Will Polygon’s [MATIC] bull rally come to a grinding halt? Assessing…
- MATIC, worth $56 million, was transferred to a whale address before its price surged.
- Metrics and market indicators supported the bulls at press time.
Polygon [MATIC] became a hot topic of discussion in the crypto space as its price pumped at an unprecedented rate. CoinMarketCap’s data revealed that MATIC registered double digit growth last week, which helped it re-enter the top 10 club. At press time, it was trading at $1.14, with a market capitalization of more than $9.9 billion.
Is your portfolio green? Check the Polygon Profit Calculator
Santiment pointed out an interesting piece of information, however, that gave an understanding of the reason behind MATIC’s bull rally. According to the tweet, on 25 January, the largest MATIC transfer of 2023 thus far took place, which was followed by a price surge.
MATIC worth $56 million was transferred to a whale address before the price hike. The address already held 585k Ethereum [ETH].
🐳 On Wednesday, the largest $MATIC transfer of the year occurred just prior to this +20% pump. This address had already been holding 585k #Ethereum as well. Often times, just one or a few whale addresses is all it takes, like in this #Polygon example. 👀 https://t.co/9qALIlE5Lu pic.twitter.com/EjqIOld5ml
— Santiment (@santimentfeed) January 28, 2023
A trend reversal for MATIC?
Since a major reason behind this surge was whale activity, a look at MATIC’s on-chain performance would help investors better understand the possibility of a trend reversal.
MATIC’s exchange reserve was decreasing at press time, which was a positive signal, as it suggested less selling pressure. The same remained true for the net deposits on exchanges, as they were low, too.
The network’s four-week price volatility increased sharply. Santiment’s chart revealed that MATIC’s MVRV Ratio was considerably up, further increasing the chances of a continued uptrend.
Furthermore, MATIC’s daily on-chain transaction volume in profit registered an uptick, which was also positive.
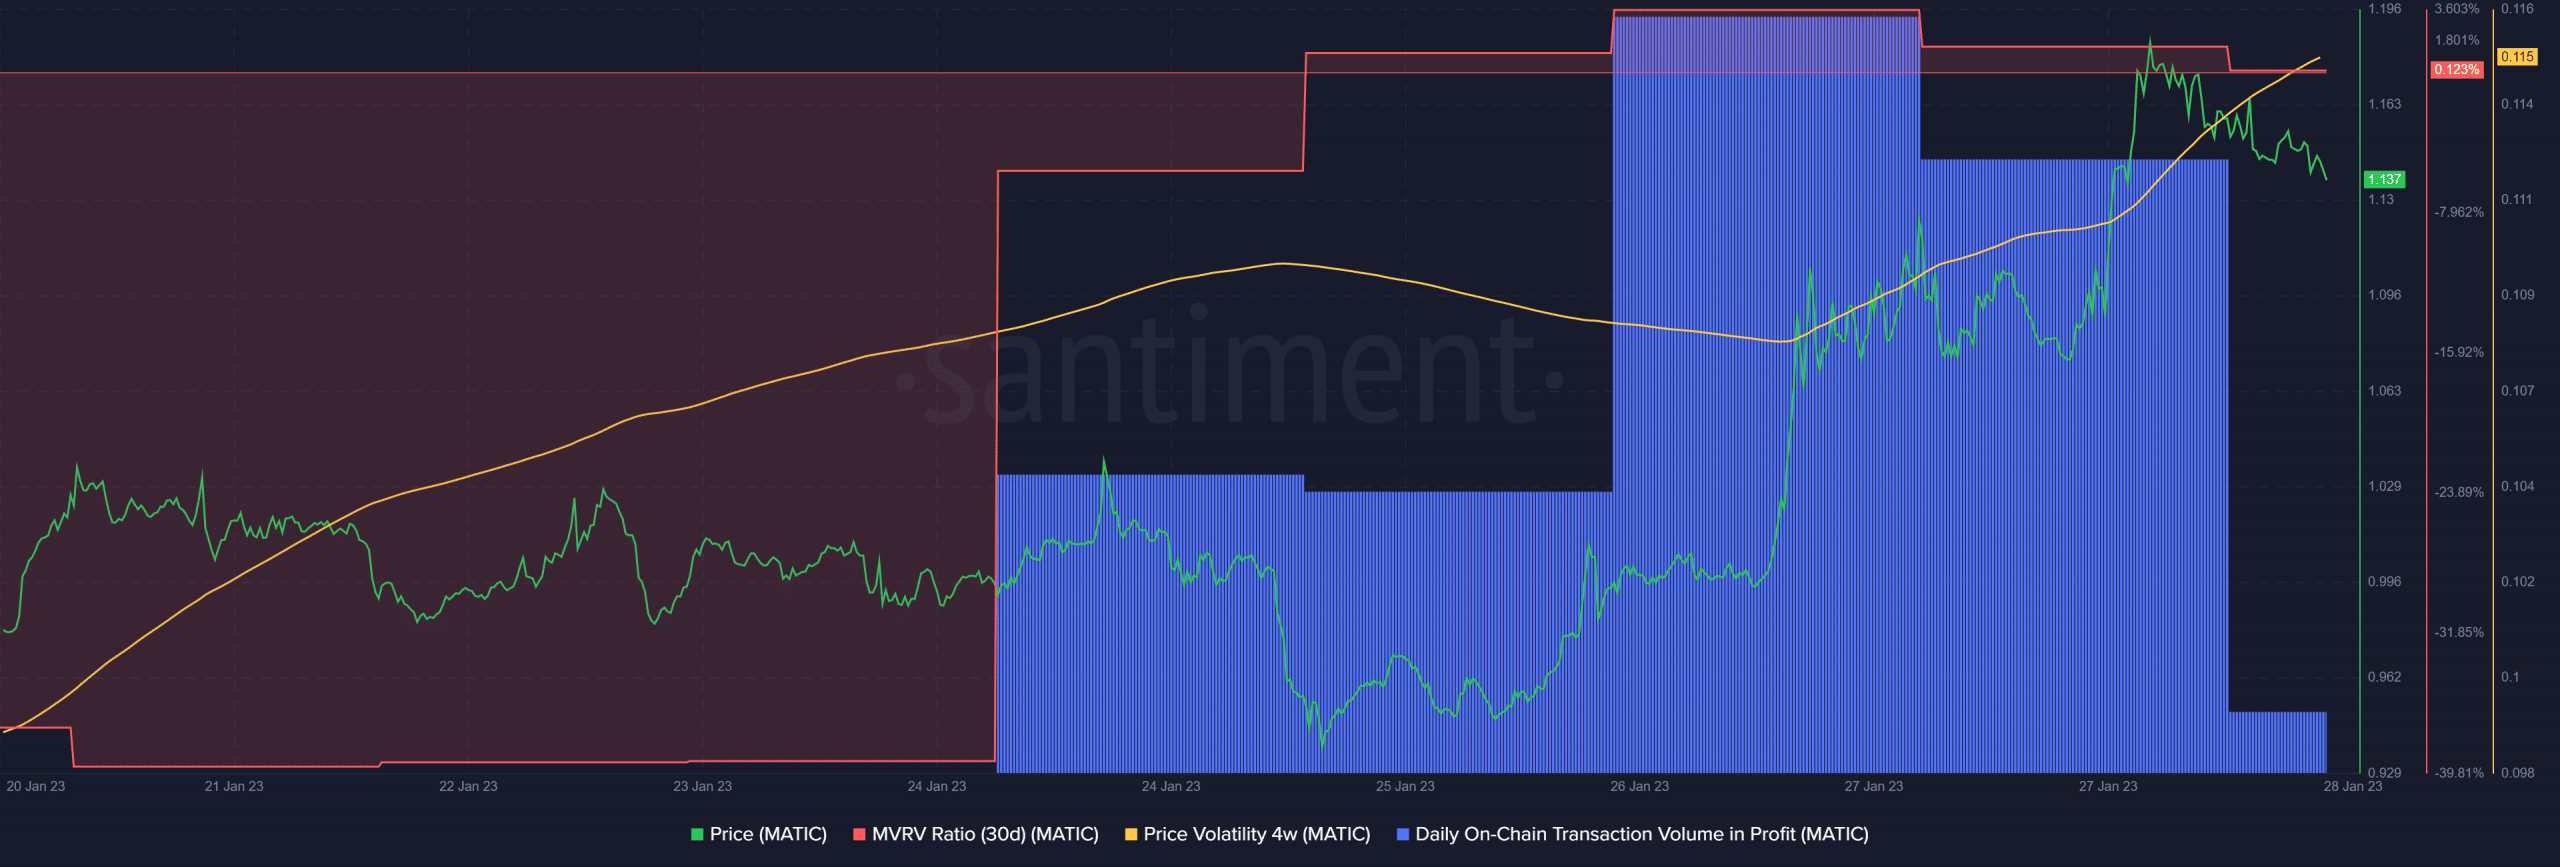
Source: Santiment
Read Polygon’s [MATIC] Price Prediction 2023-24
More good news
Apart from the aforementioned metrics, a few other things were also working in MATIC’s favor. DeFiLlama’s data suggested that Polygon’s total value locked was increasing over the past few weeks. It was also recently revealed that MATIC out-performed Ethereum in terms of daily active addresses.
MATIC’s daily chart also looked pretty bullish. For example, the Exponential Moving Average (EMA) Ribbon indicated a bullish advantage in the market as the 20-day EMA was above the 55-day EMA. The MACD also told a similar story.
However, the Relative Strength Index was in the overbought zone, which might restrict MATIC’s price from surging further.
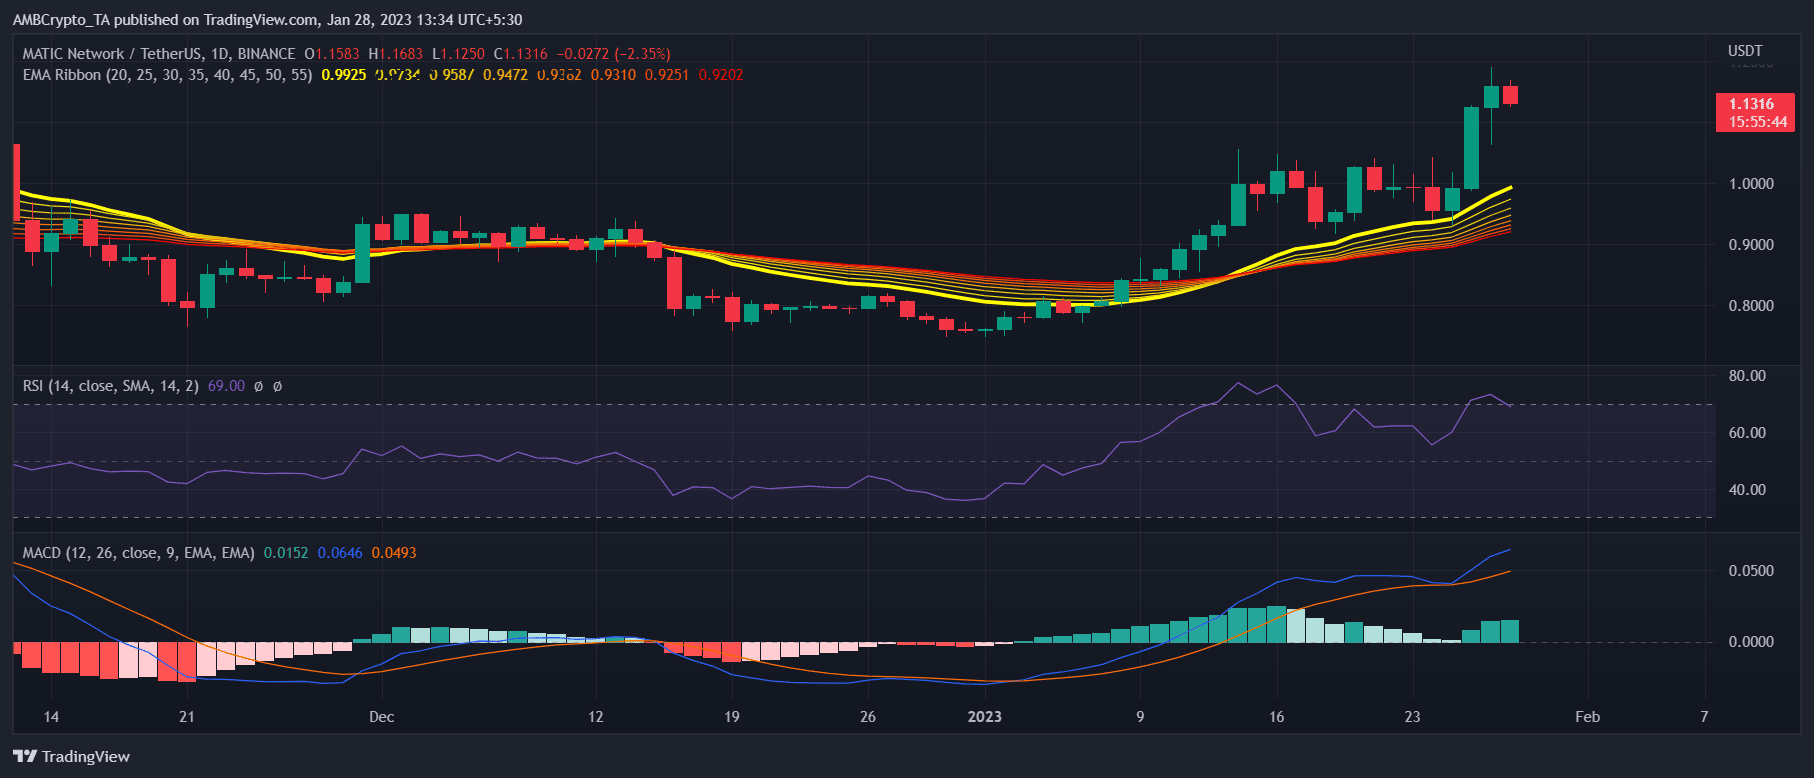
Source: TradingView


