Shiba Inu [SHIB]: Extra gains could be unlikely if this obstacle persists
Disclaimer: The information presented does not constitute financial, investment, trading, or other types of advice and is solely the writer’s opinion.
- SHIB reached a lower-time frame bearish order block (OB) on the 12-H chart.
- A price rejection at this OB could tip the scales in favor of the bears.
Shiba Inu [SHIB] began the new year on a high note. It rallied from $0.00000792 to $0.00000880, offering over 10% gains. The rally followed Bitcoin’s [BTC] uptrend in the same period.
At press time, SHIB was trading at $0.00000849. The 12-hour chart candlestick showed a shooting star with a long tail wick, indicating the intense opposition SHIB bulls faced from sellers.
The above price rejection occurred in a bearish order of $0.00000855 that existed on the three-hour chart. If this obstacle persists (red zone), SHIB bulls could lose ground to bears, forcing a price drop to this level.
Read Shia Inu’s [SHIB] Price Prediction 2023-24
The $0.00000855 obstacle: Can the bulls overcome it?
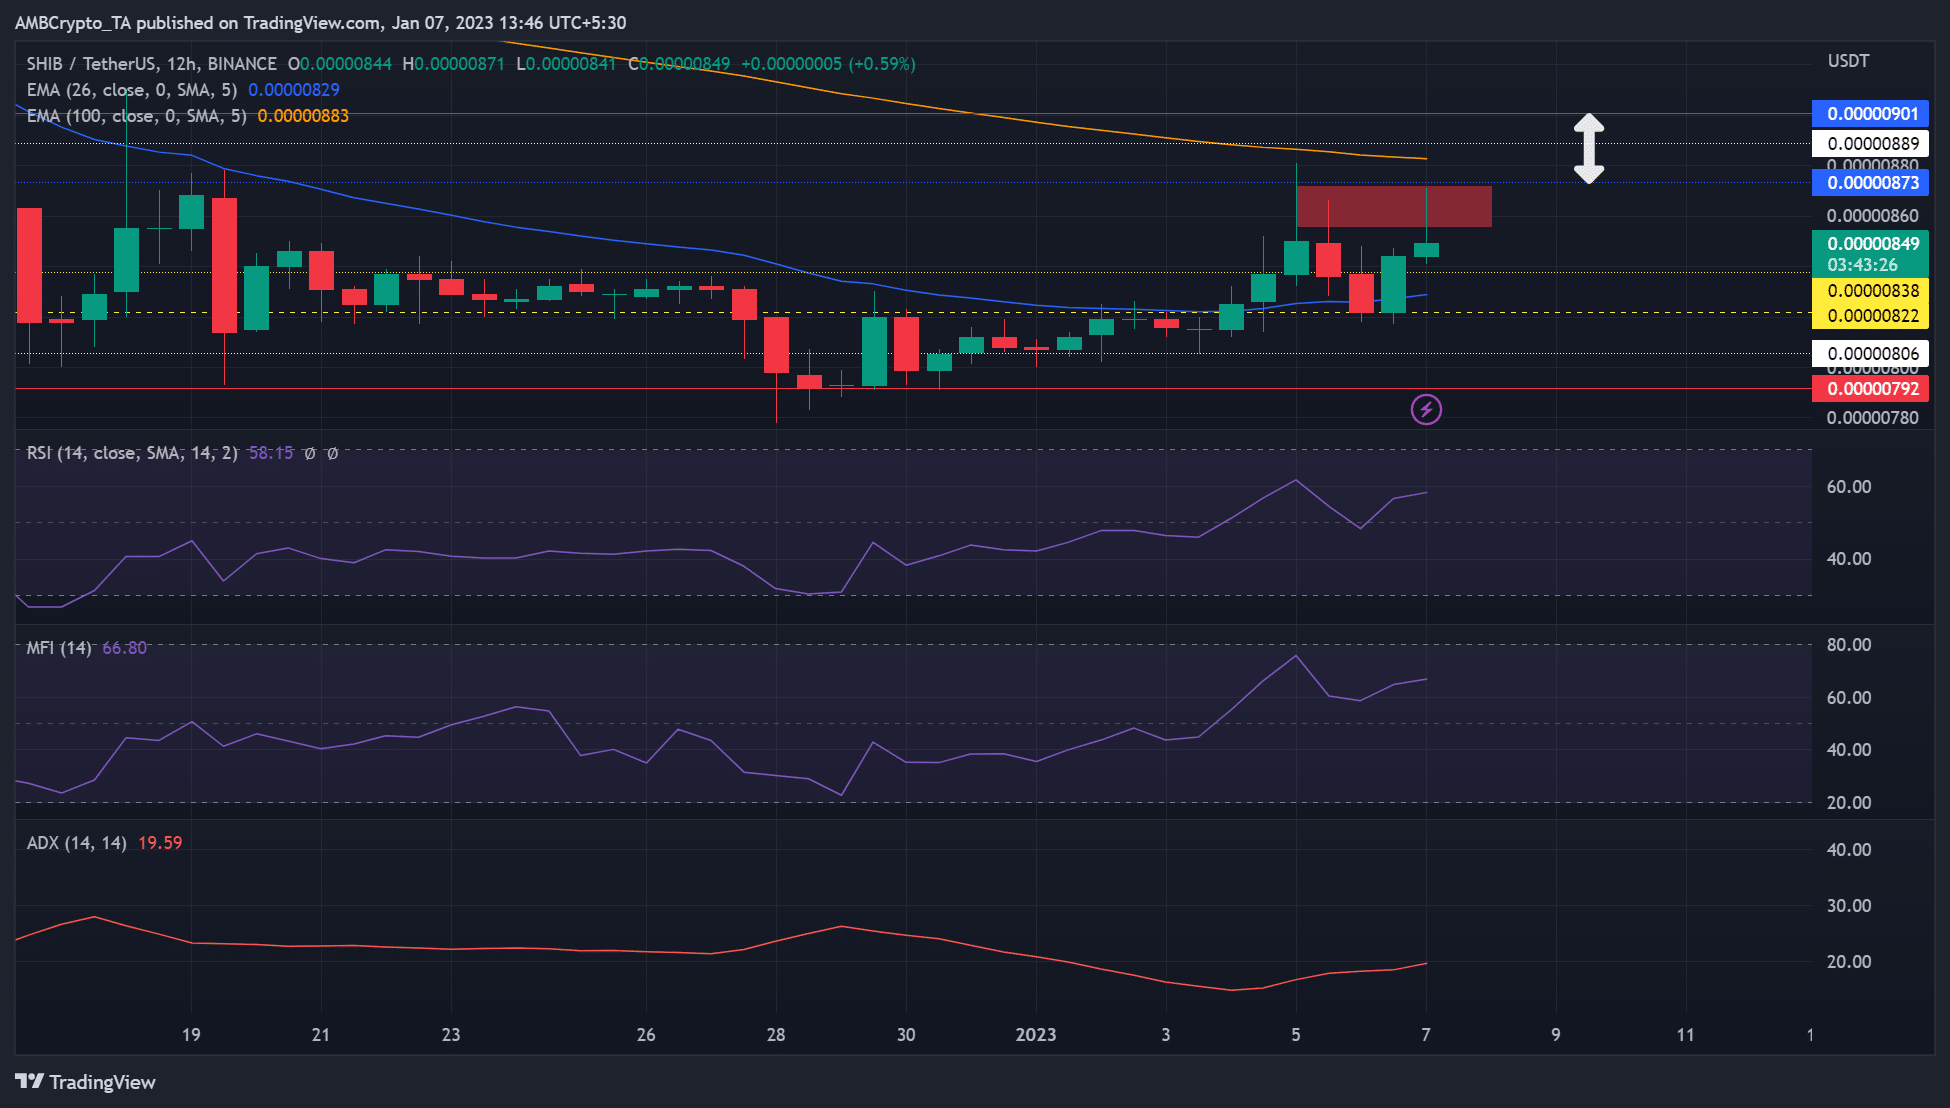
Source: SHIB/USDT on TradingView
SHIB dropped below its late December trading range of $0.00000822 – $0.00000836 (yellow lines). But the $0.00000792 kept the downtrend in check, offering bulls strong support to launch a rally.
The rally started on 1 January 2023 but was forced to cool off after hitting the obstacle (red zone). The correction settled on the late December trading range support of $0.00000822.
Nevertheless, another rally, at press time, struggled to overcome the obstacle. If the obstacle persists, SHIB could face another pullback to $0.00000822 in the next day or two. Therefore, if a trend reversal is confirmed, the level can serve as a short-selling target for bears.
The Relative Strength Index (RSI) and Money Flow Index (MFI) faced rejections at 50-mark and 60-mark, respectively. Afterward, the indicators moved upwards, indicating increased buying pressure and undergoing accumulation.
But RSI was also rejected at the 60-mark, leading to a drop in buying pressure. If the trend repeats, it could signal a price reversal.
However, a breakout above the bearish OB at $0.00000873 would give bulls more leverage and invalidate the bearish forecast.
In addition, investors should monitor the Average Directional Movement Index (ADX), which has gradually increased since 4 January. It showed an increasing uptrend trend, but it was below 20 units, indicating a weak momentum.
Shiba Inu saw a decline in trading volume and a bearish sentiment
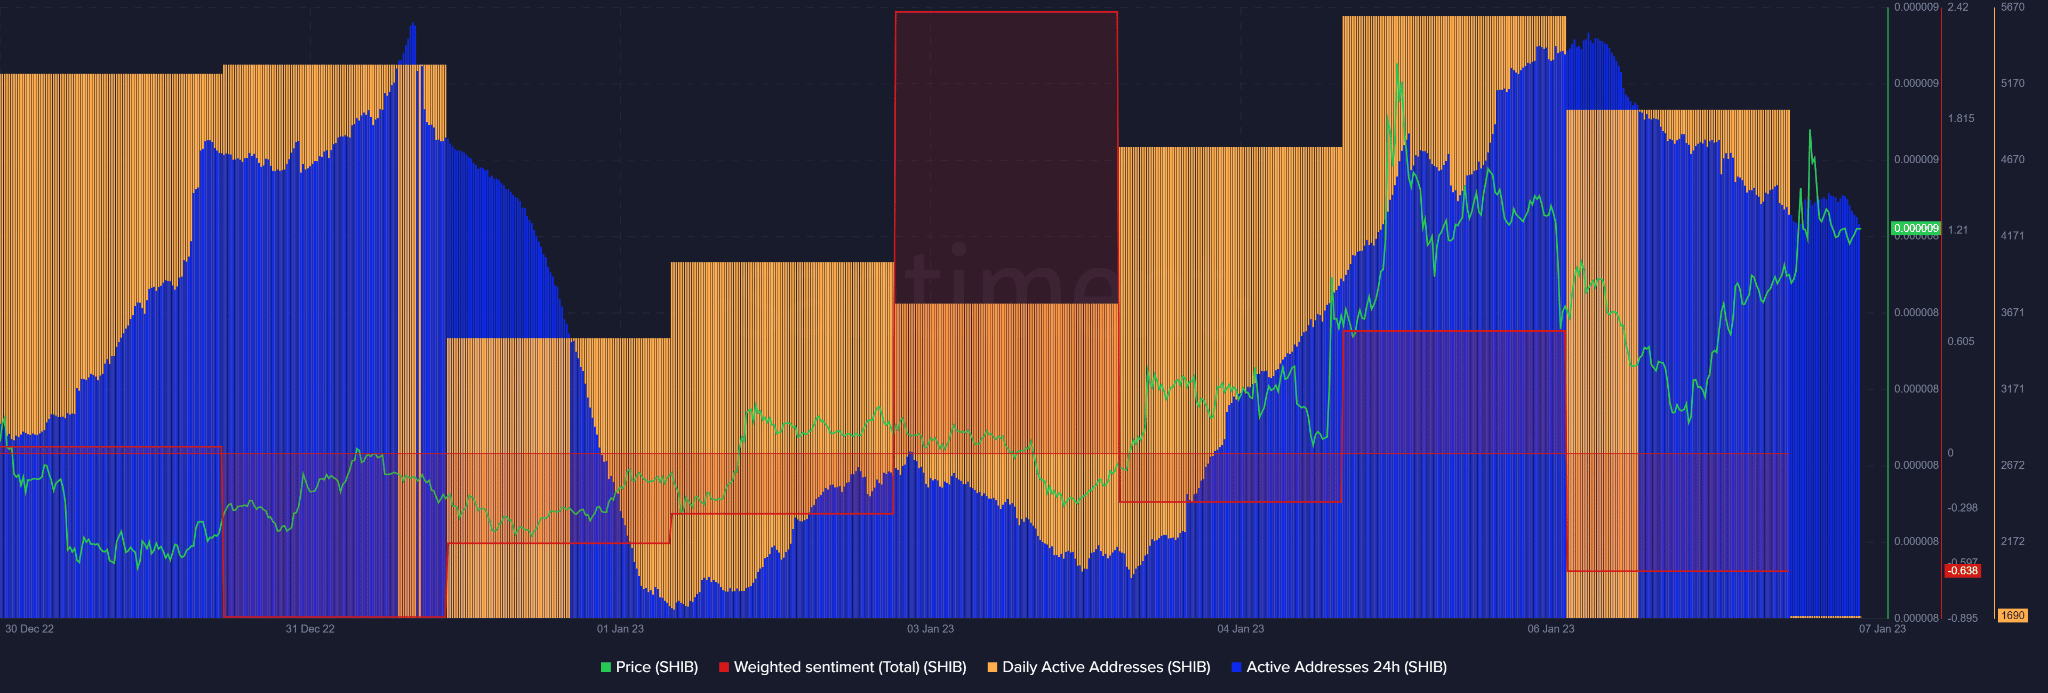
Source: Santiment
Are your holdings flashing green? Check the SHIB Profit Calculator
According to Santiment, SHIB’s daily active addresses and active addresses dropped in the past 24 hours. In addition, the weighted sentiment flipped from positive to negative. This showed a bearish outlook on the asset, as buying pressure declined.
If the trend continued, bears could gain more influence in the market.


