Analysis of on-chain stablecoin data reveals decline in USDT dominance
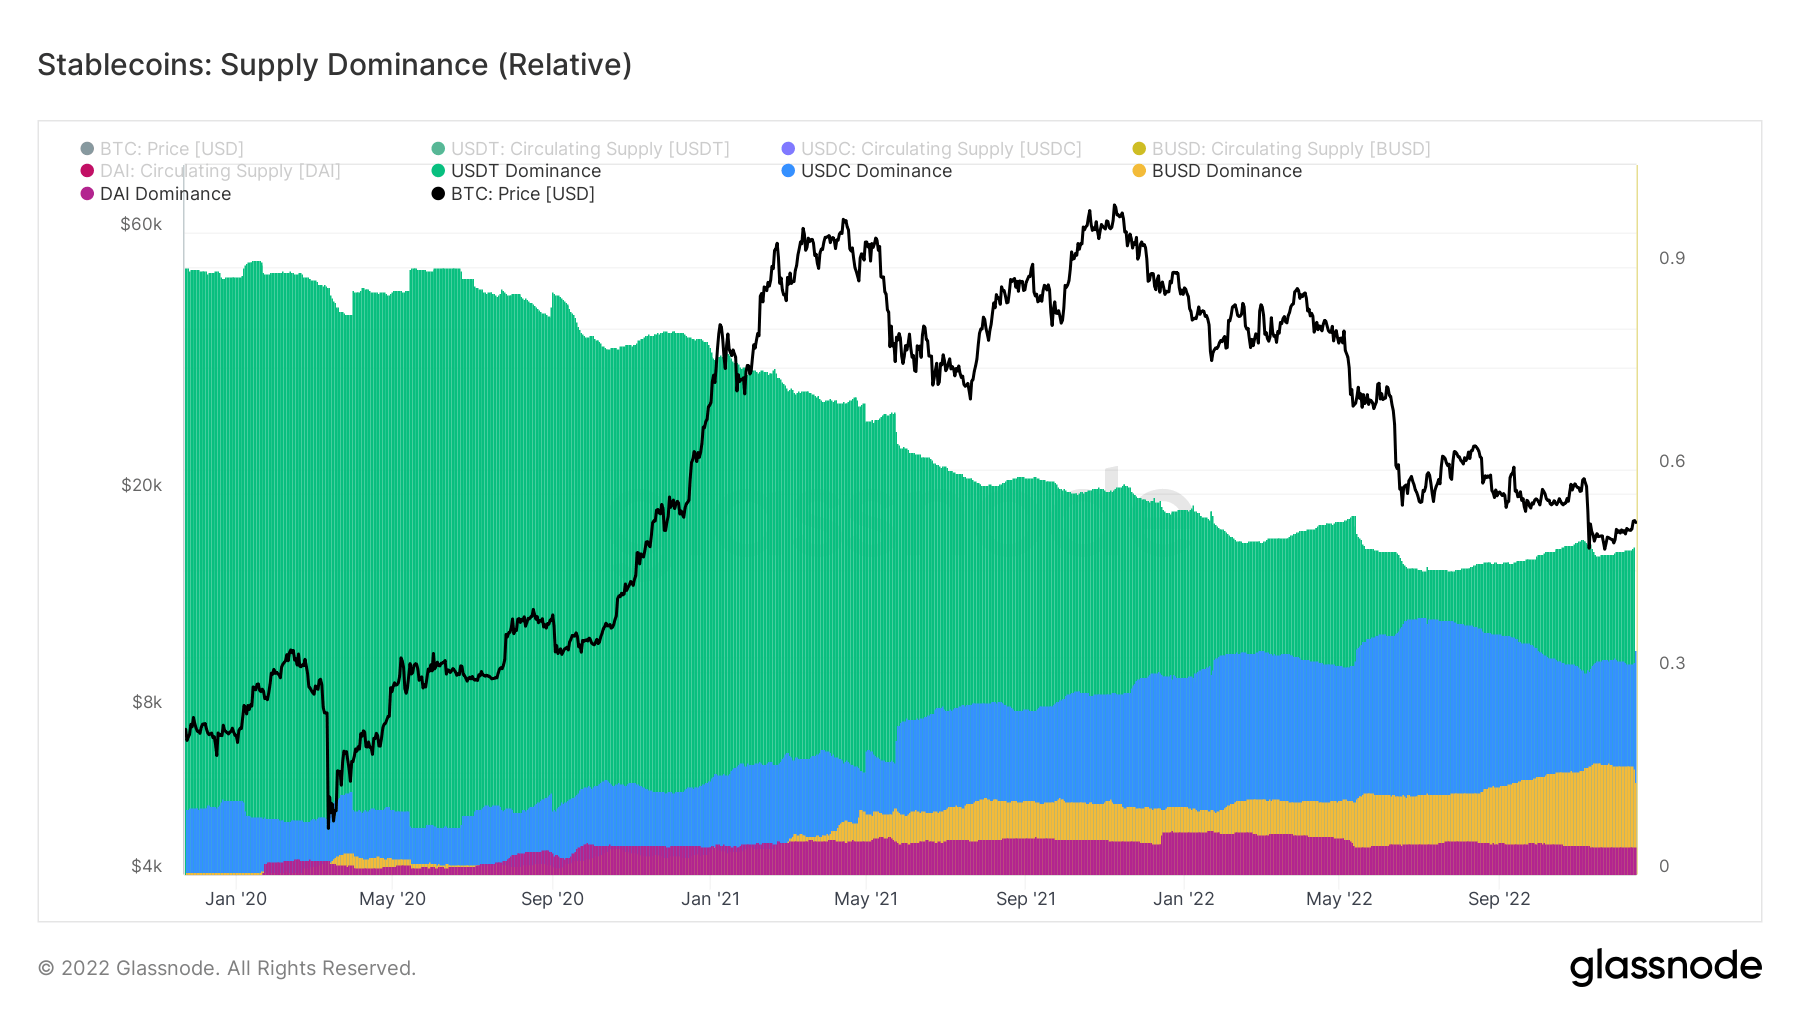
In 2019, Tether (USDT) had a global stablecoin dominance of 89%, but it has since fallen to just under 50%, according to on-chain data provided by Glassnode — analyzed by CryptoSlate.
Throughout 2020 and 2021, other stablecoins like USD Coin (USDC) and Binance USD (BUSD) began to rise, with USDC reaching 33% dominance and BUSD reaching 16% dominance. DAI, on the other hand, remained constant.

Recovery on the horizon
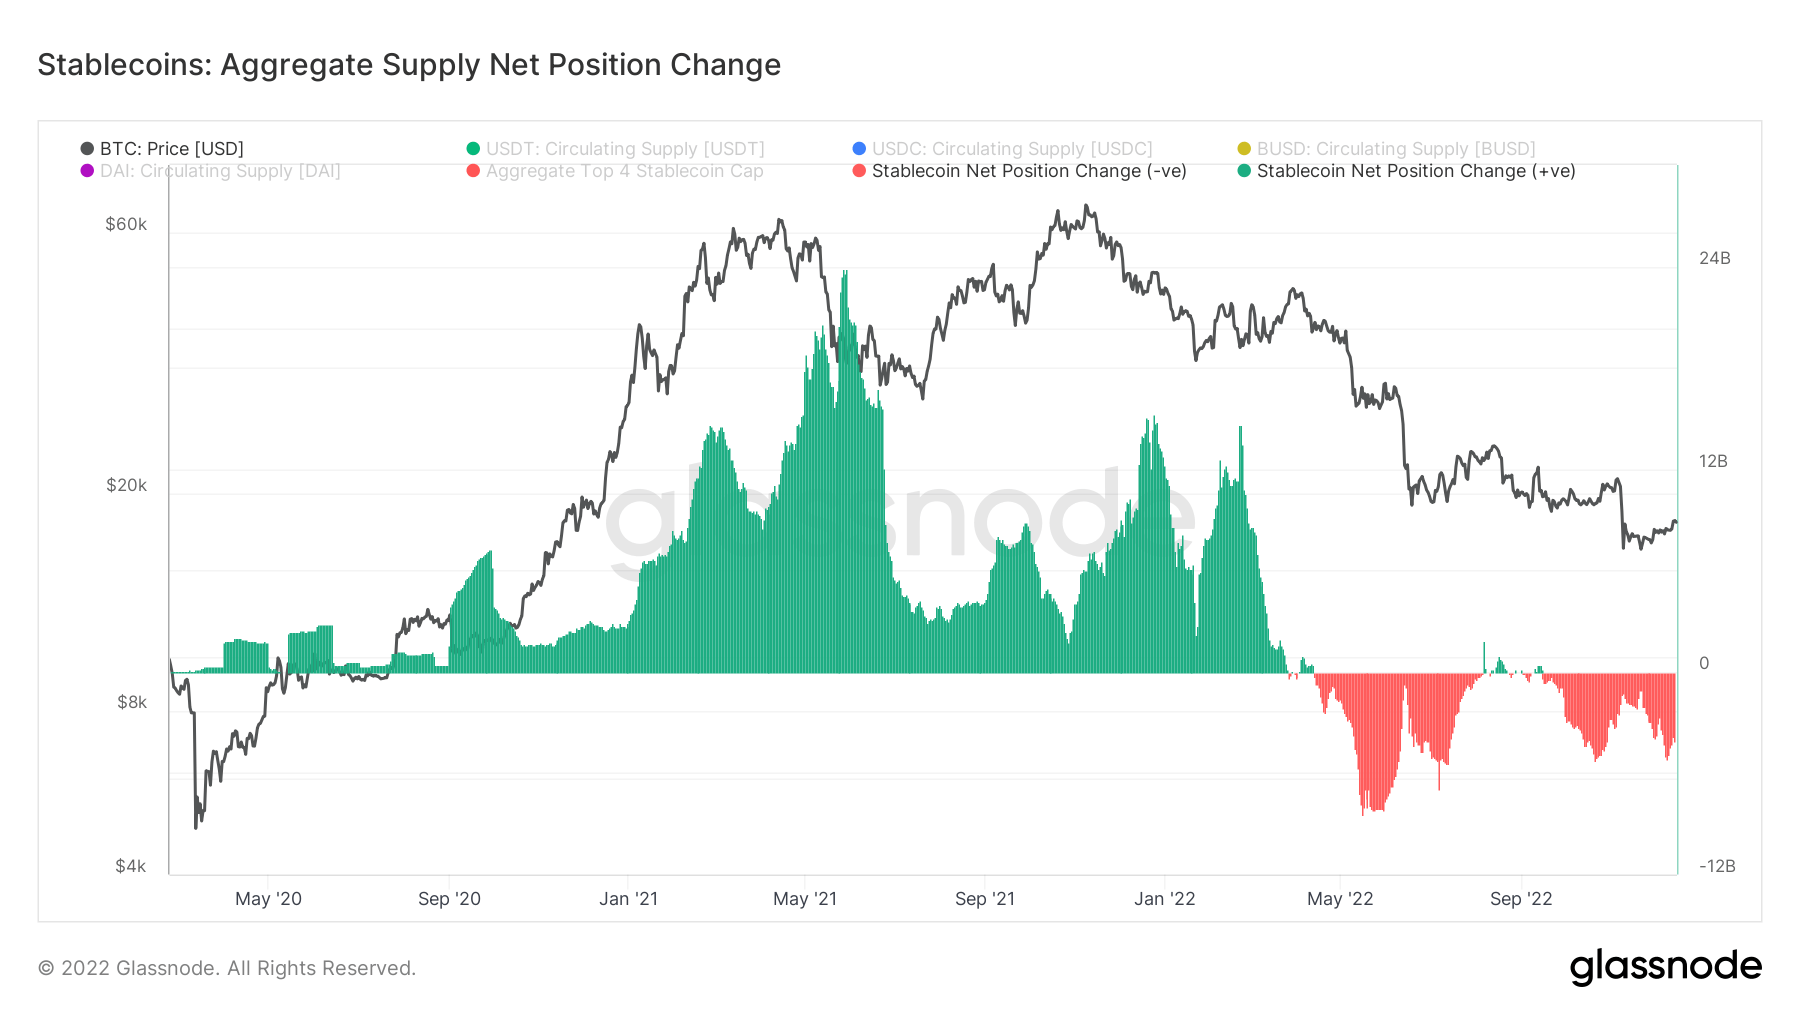
In May, USDT saw $20 billion in redemptions but has since begun to recover. The growth of stablecoins slowed, with a peak of $24 billion daily inflows. Outflows also increased but peaked at only $8 billion, indicating that most of the capital remains stablecoins.
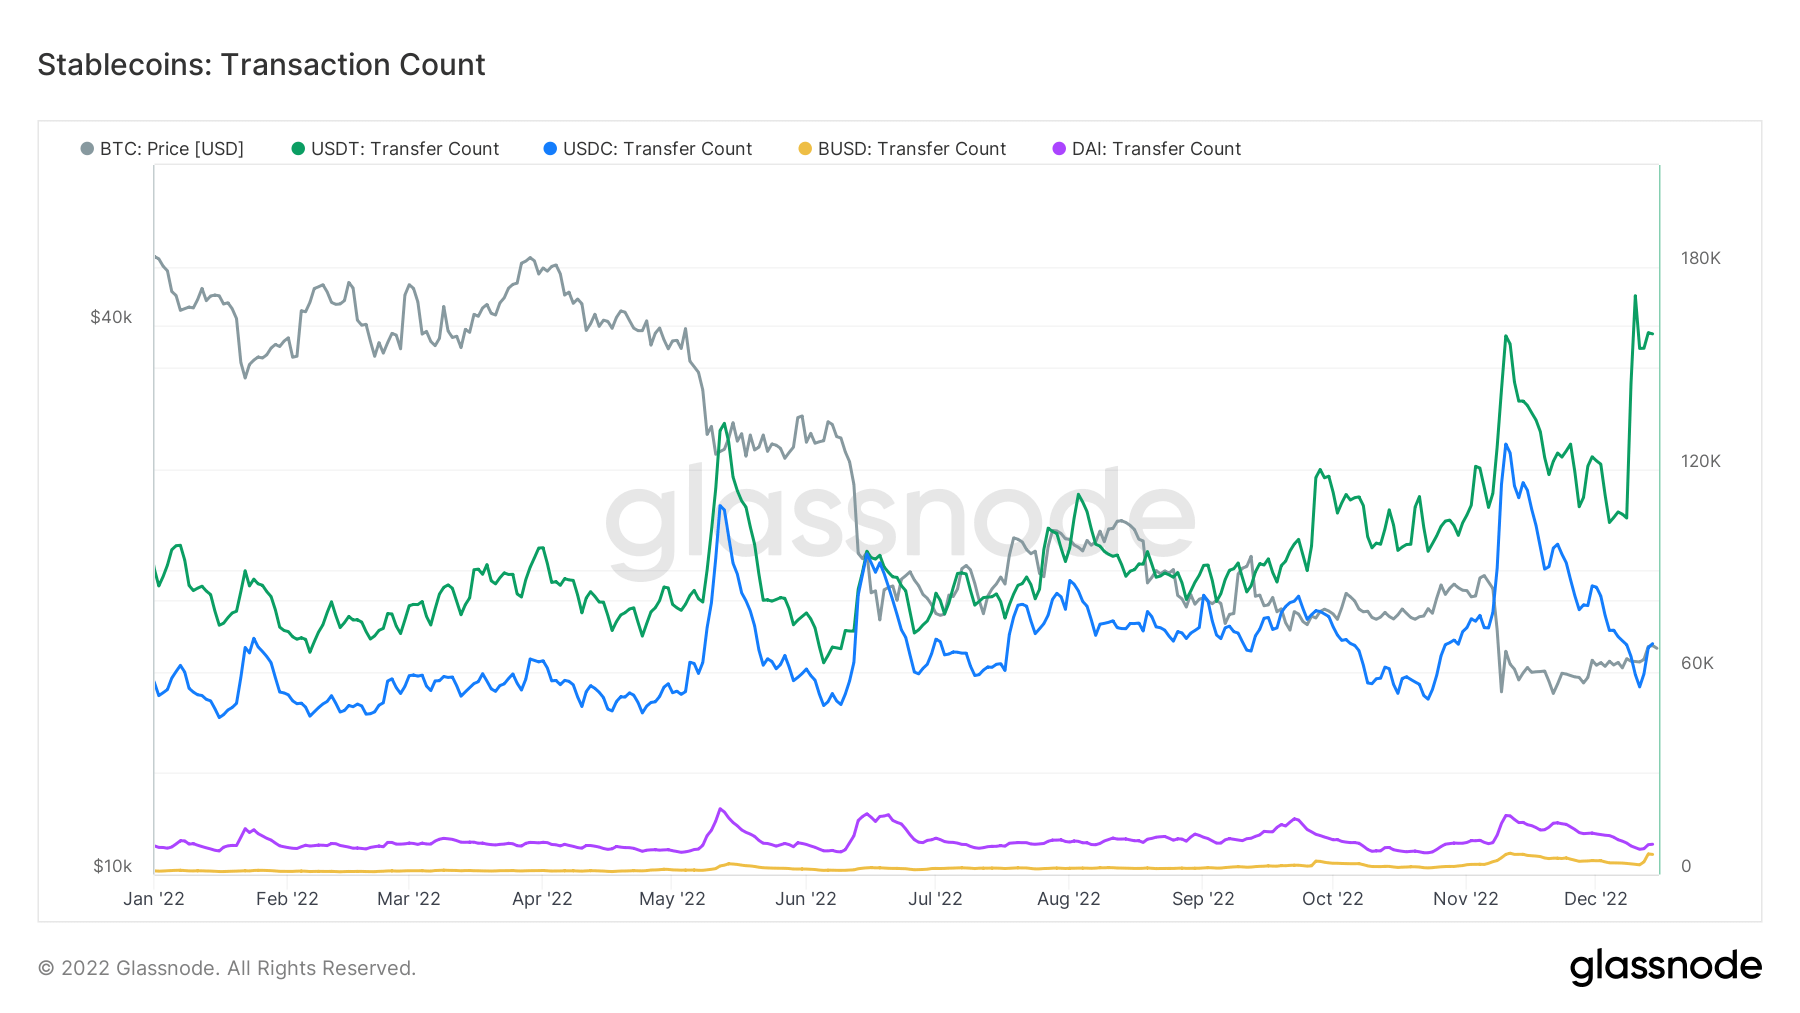
USDT remains the only stablecoin to have made higher highs in daily transactions and still see strong demand.

Total stablecoins on exchanges
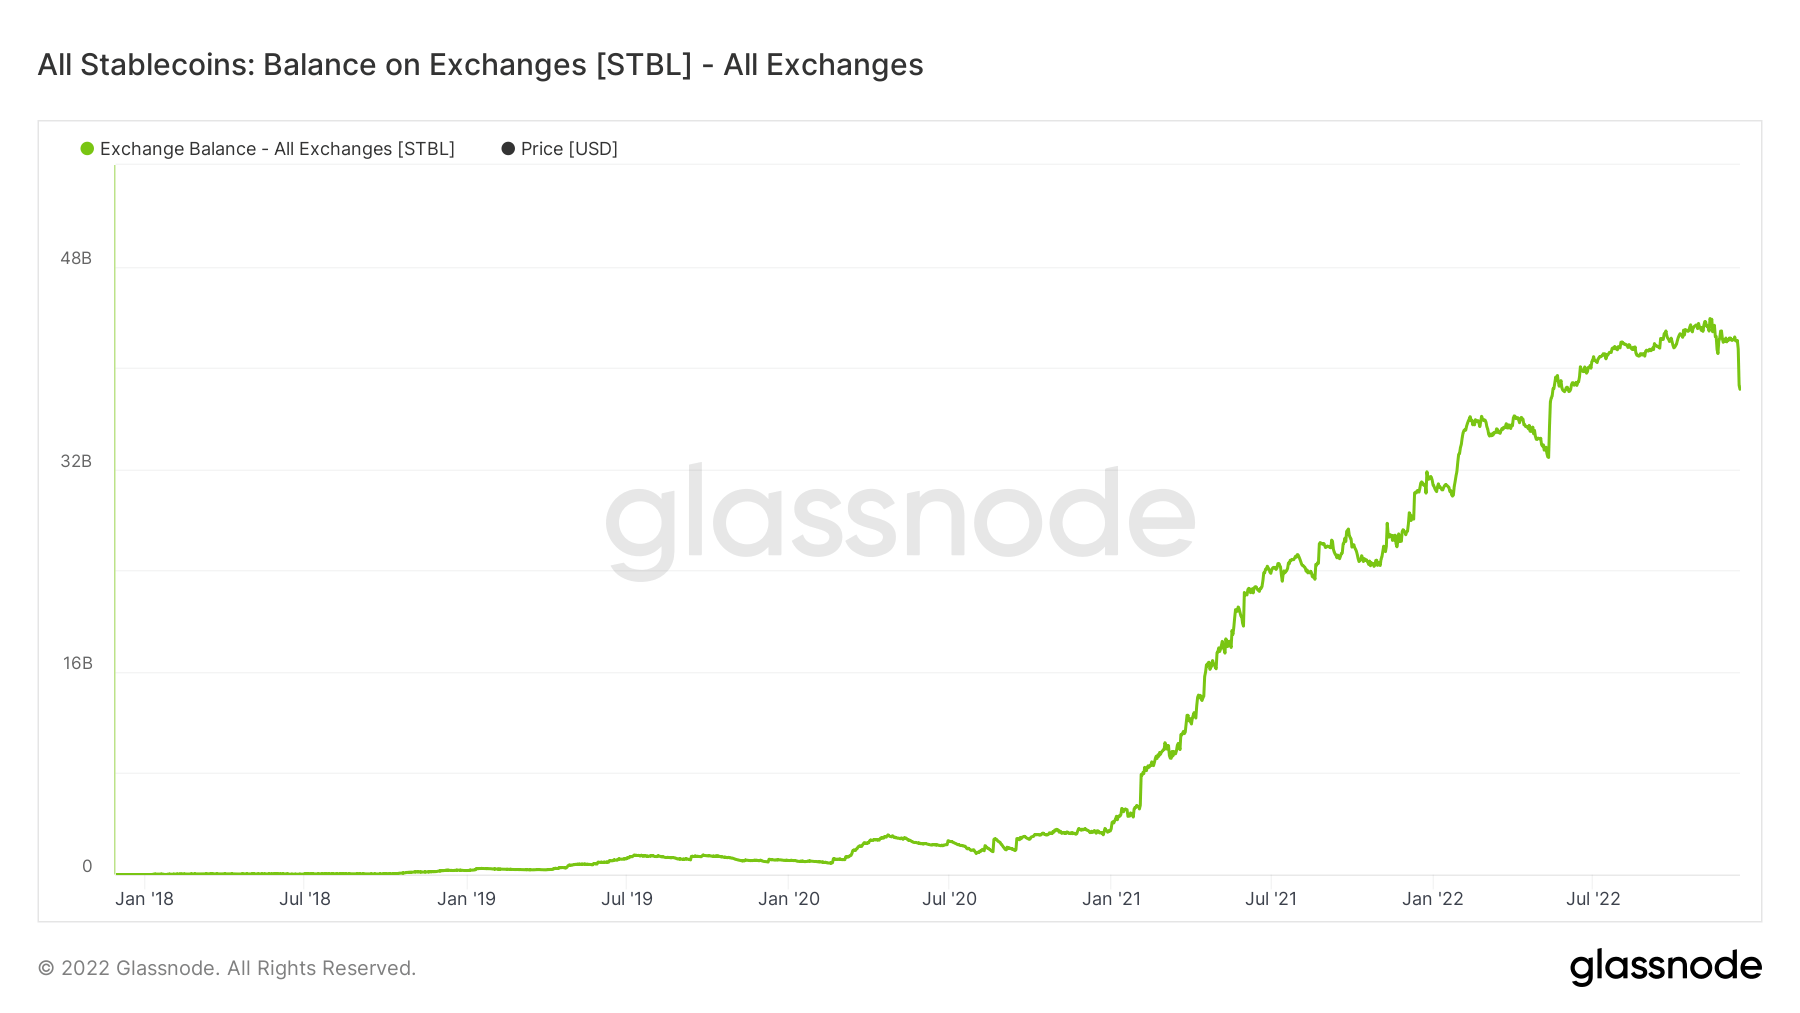
There is approximately $40 billion worth of stablecoins on exchanges, with a total of $4 billion being redeemed this week alone. This indicates that investors still believe in stablecoins and are likely waiting for the next bull run or dip.

By analyzing the STBL virtual asset Glassnode data – which aggregates data from all ERC20 stablecoins – we can see the growth of stablecoins was significant up until March, reaching a peak of $24 billion in daily redemptions.
Risk-on to Risk-off
This year’s risk-off environment has shifted from inflows to outflows for stablecoins, though the outflows have been relatively small, reaching a maximum of $8 billion. Despite this, the majority of capital remains in stablecoins.

USDC saw a 10% rise over the same period and has since increased to 33%. It peaked in June with 38%, leading to speculation about a potential flip of USDT.
On the other hand, BUSD did not gain significant traction until the second half of the year, with a dominance of 10%. It has since grown to 16% dominance and has been gaining momentum, particularly since the collapse of FTX.


