Bitcoin (BTC) Price Analysis for December 2

Does Bitcoin (BTC) have chances for upward move by end of week?
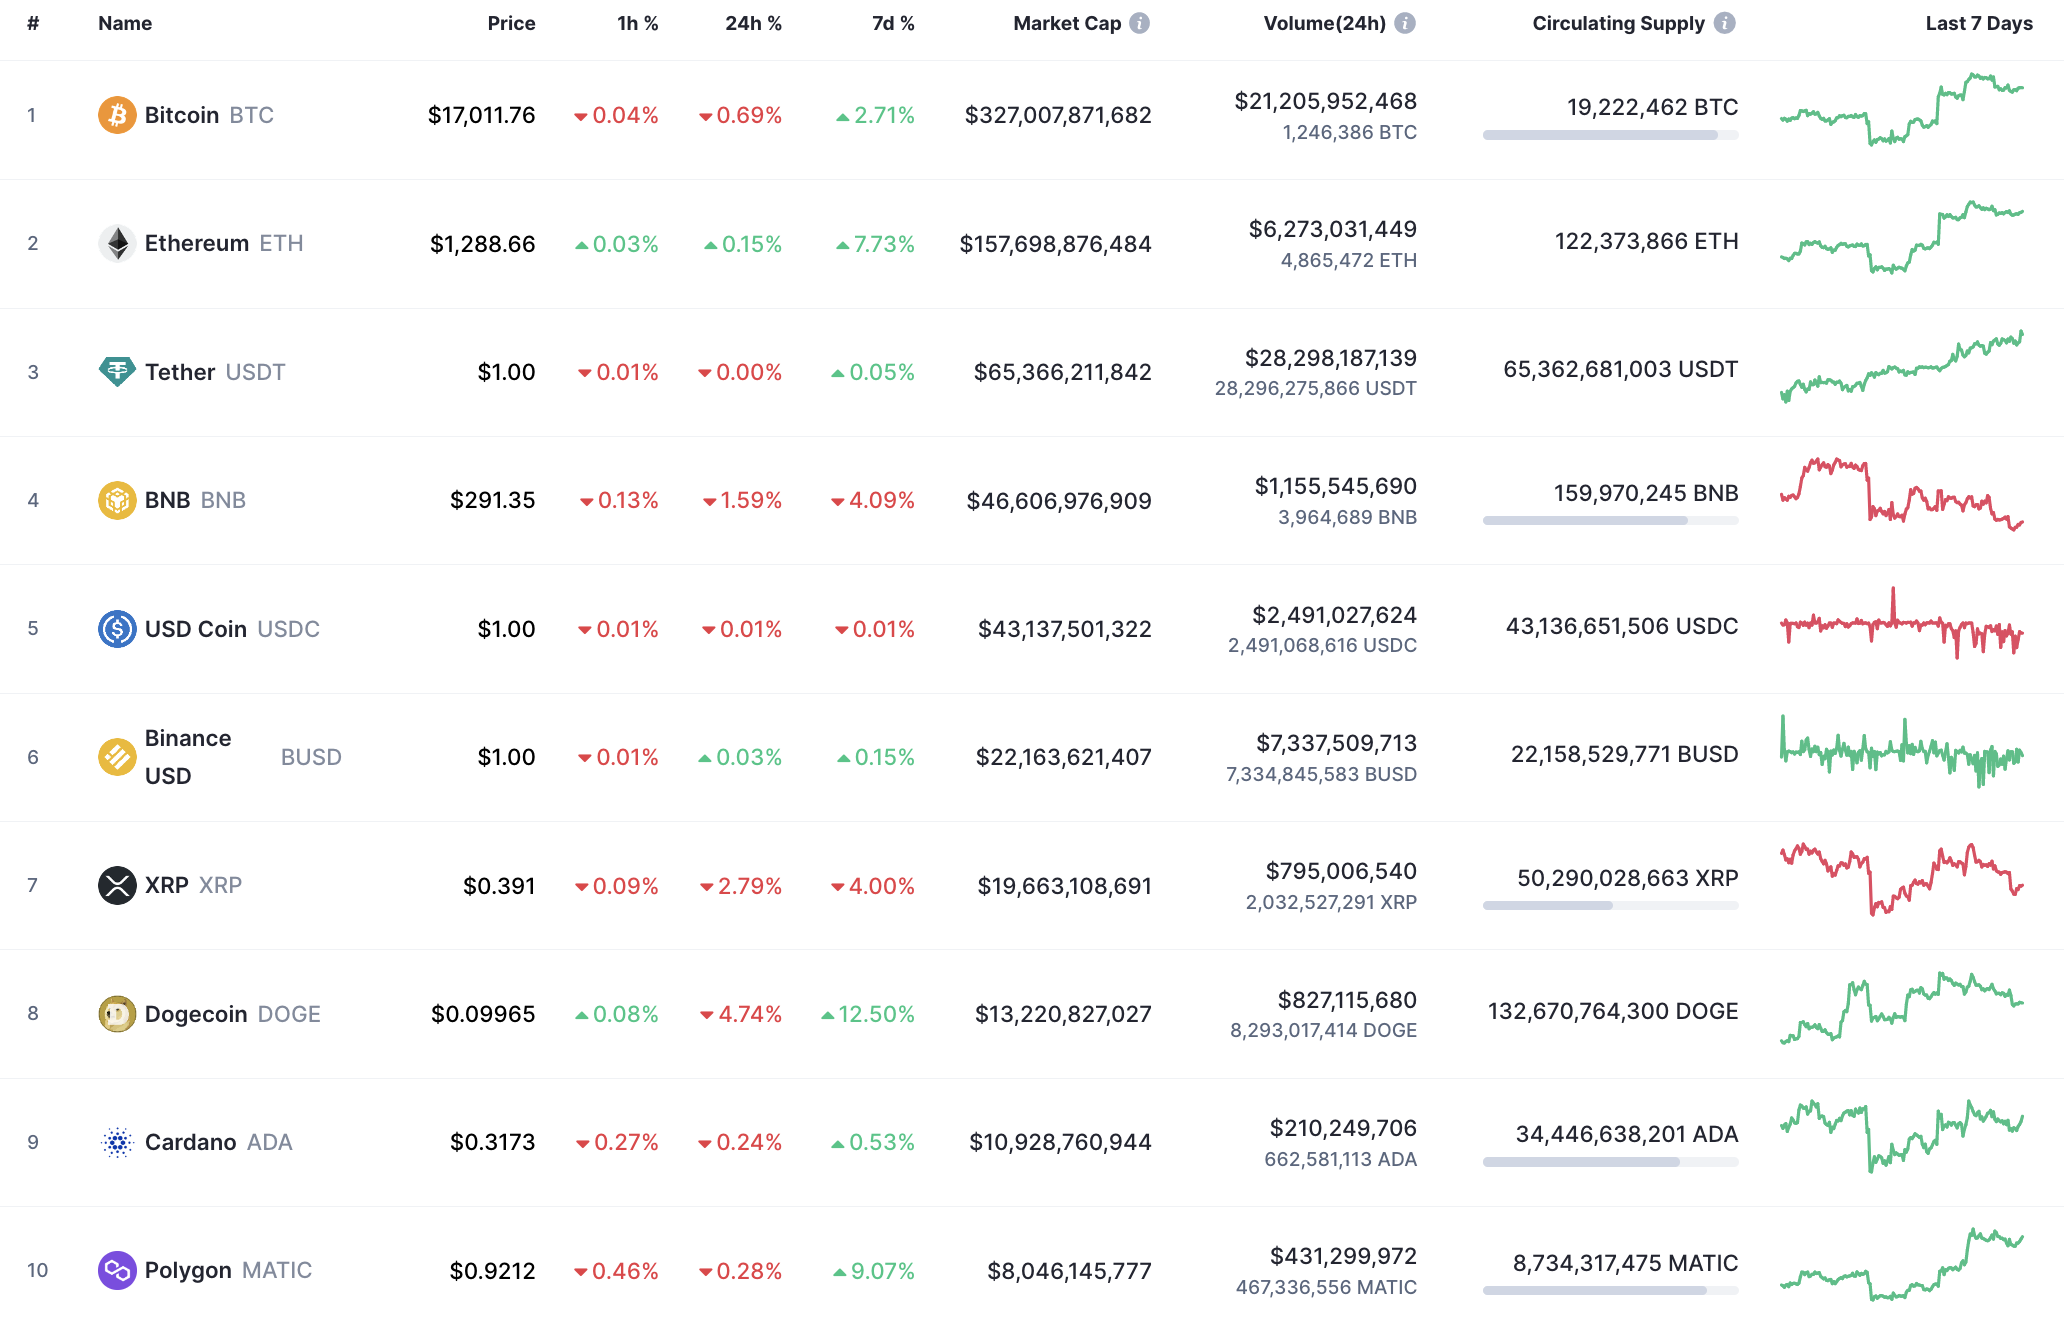
Most of the coins could not come back to the bullish trend, according to the CoinMarketCap ranking.
BTC/USD
The rate of Bitcoin (BTC) has dropped by 0.69% over the past 24 hours.
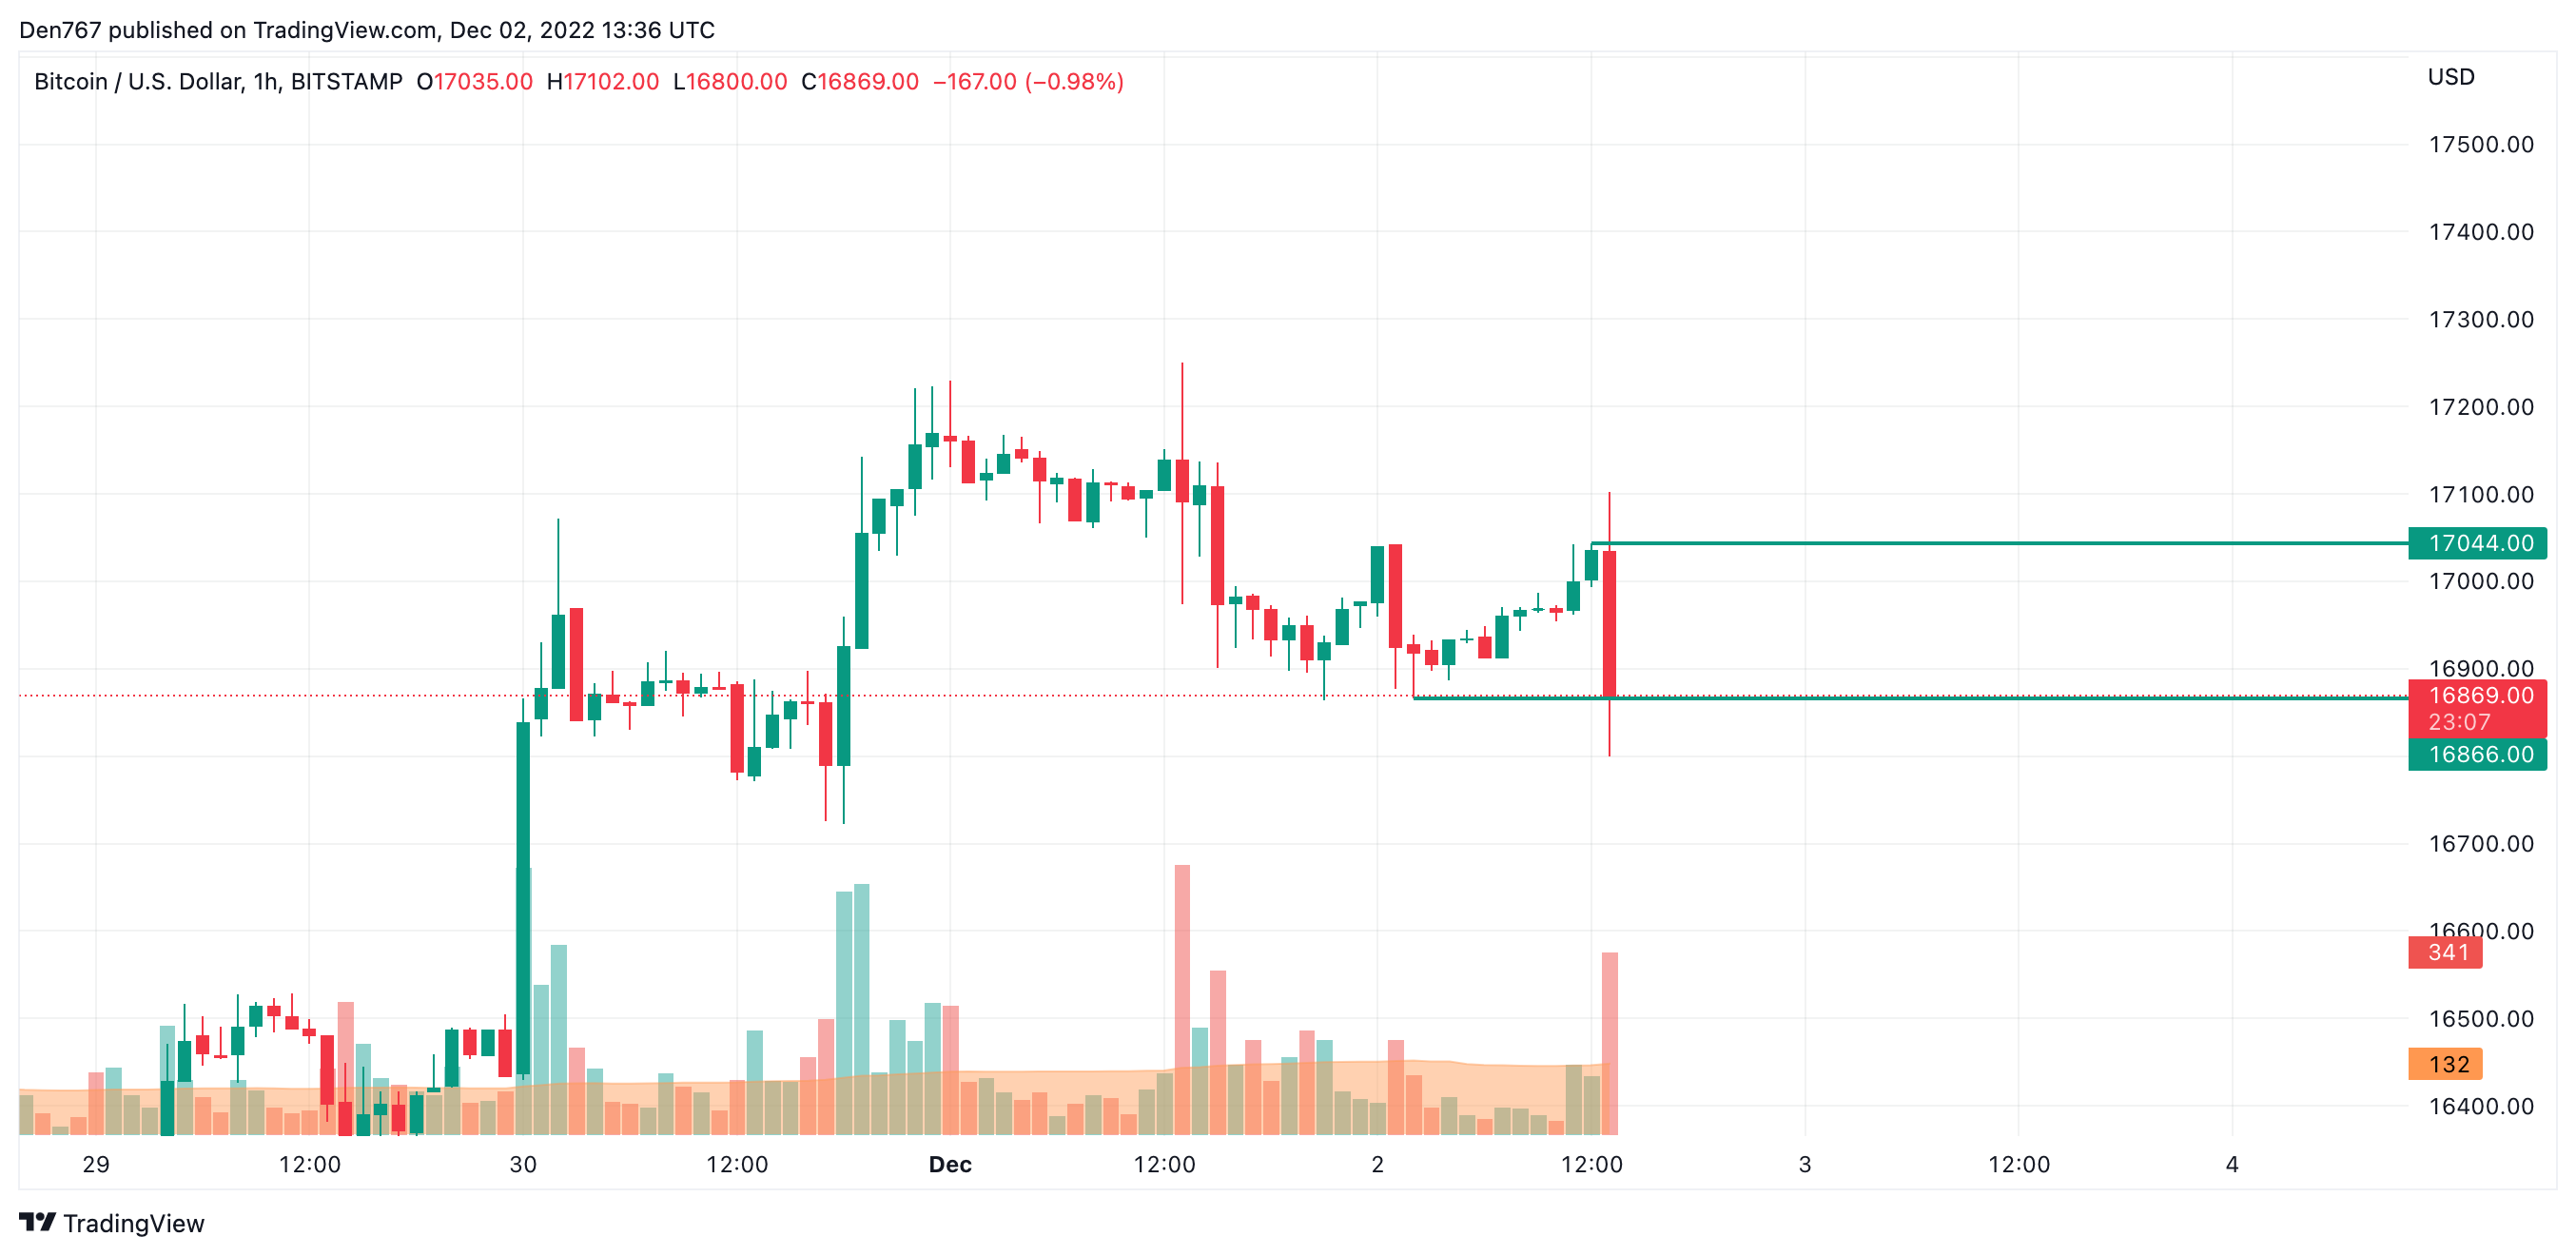
On the hourly chart, Bitcoin (BTC) has come back to the local support level of $16,866. If buyers cannot hold it, the fall may lead to the test of the $16,600-$16,700 zone tomorrow.
In addition, the selling volume is high, which means that bears are controlling the situation.
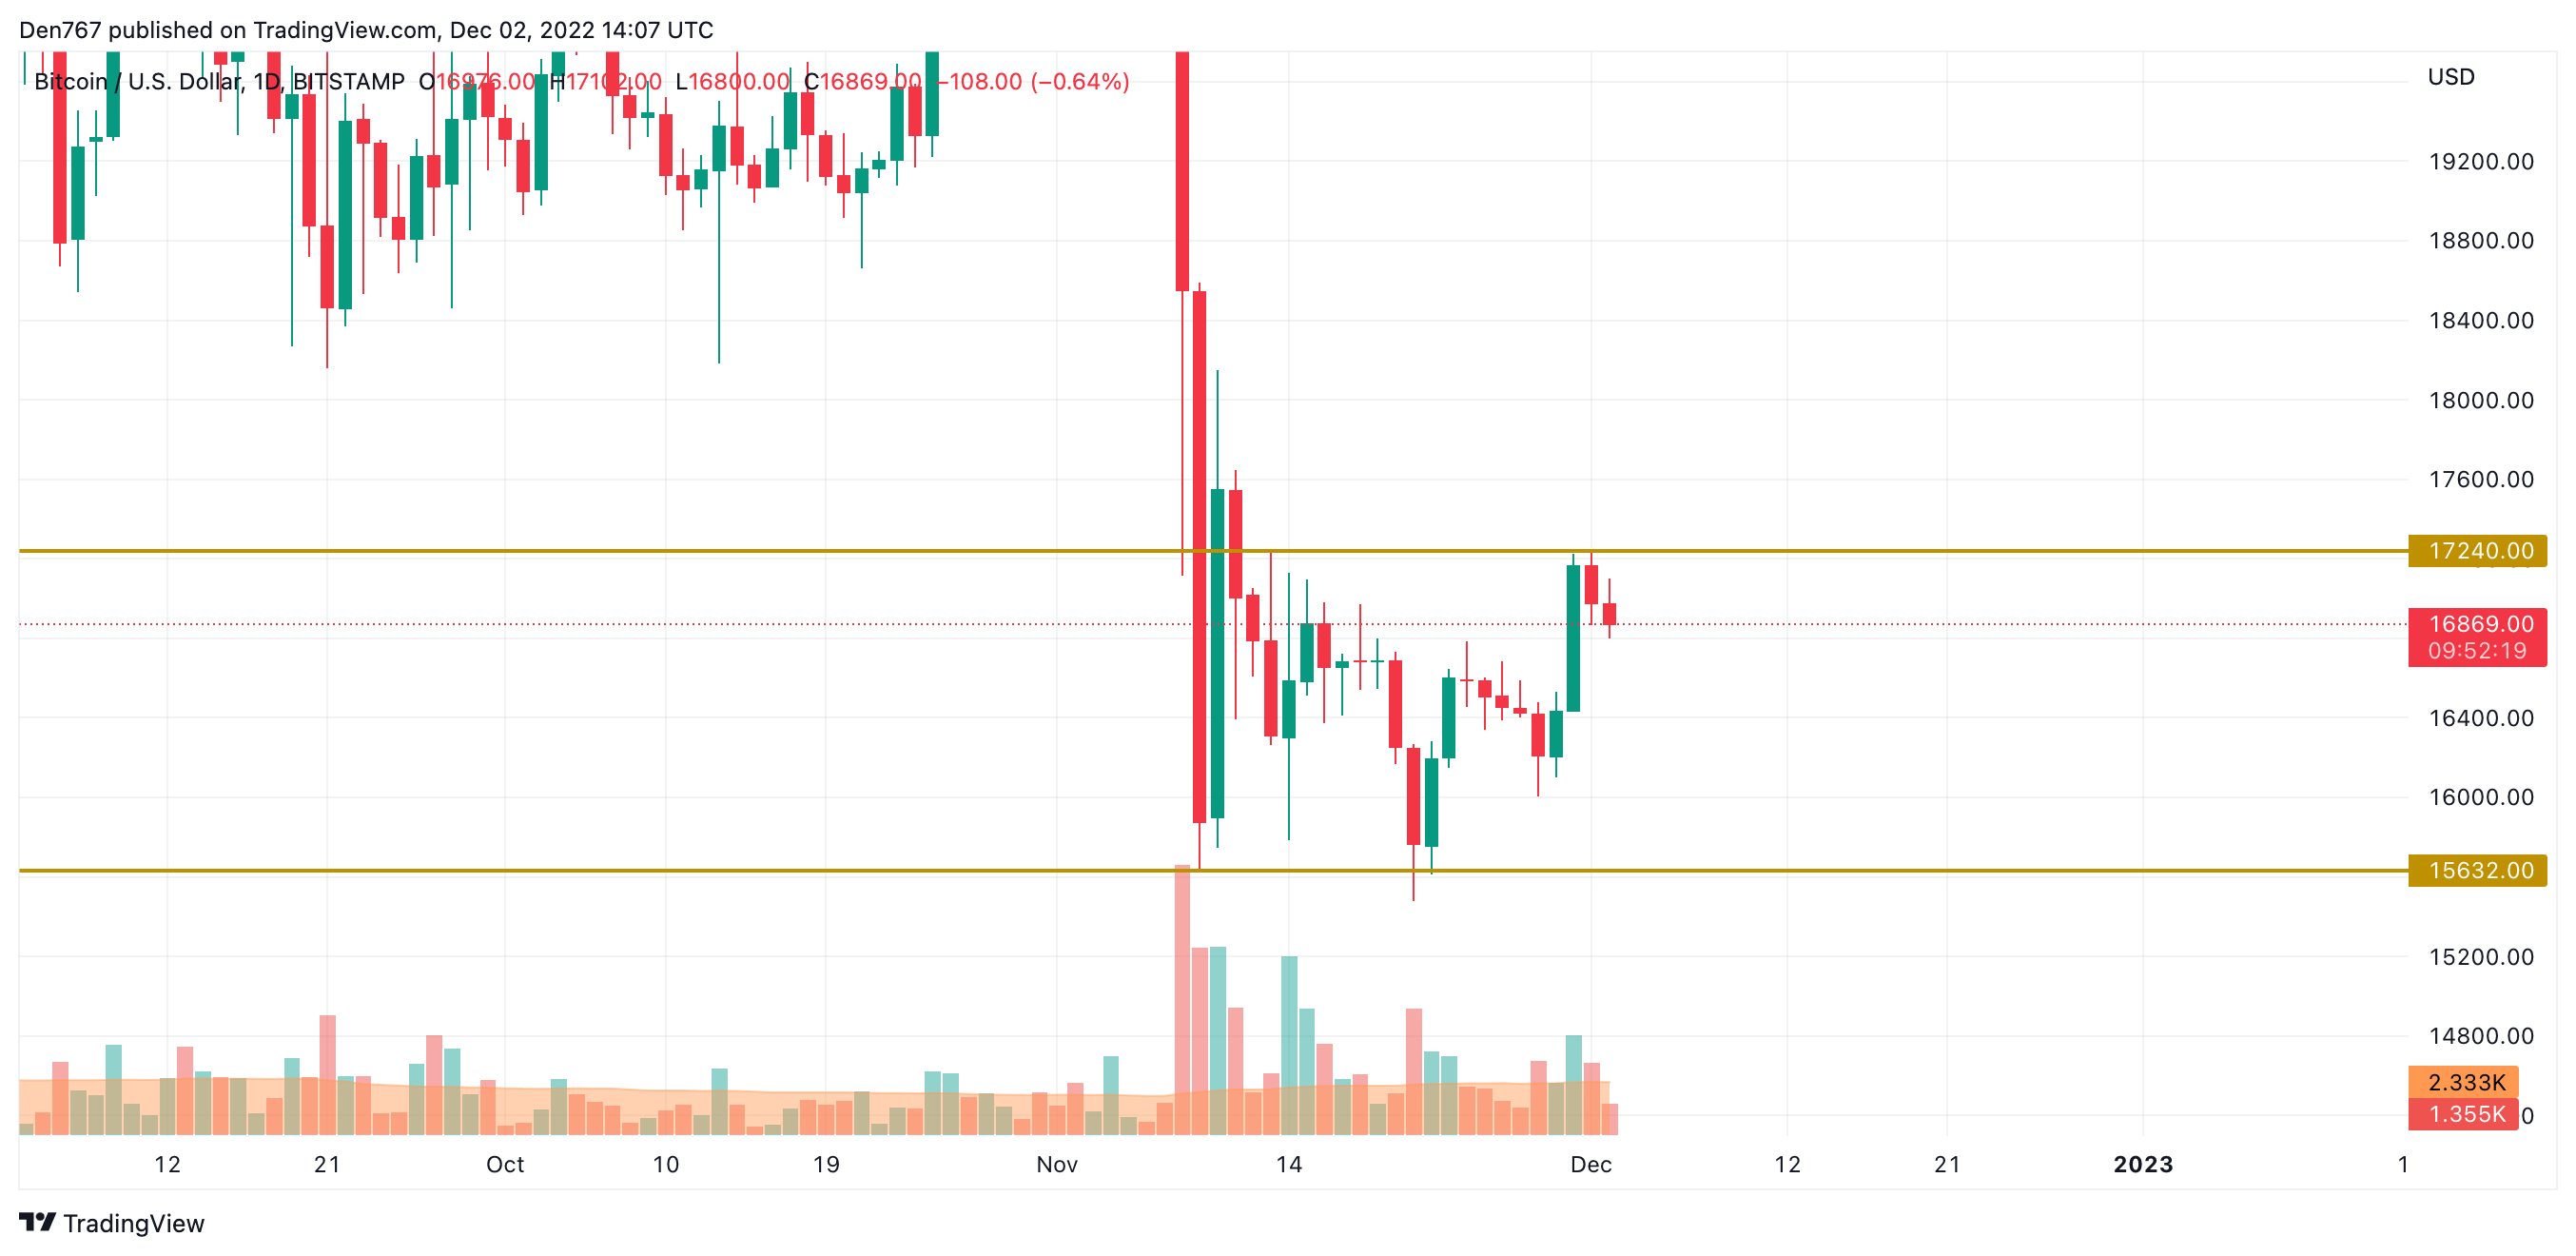
On the daily time frame, Bitcoin (BTC) is not as bullish as before as buyers lost the vital $17,000 level. If sellers’ pressure continues, the decline may continue to the $16,500 area within the next few days.
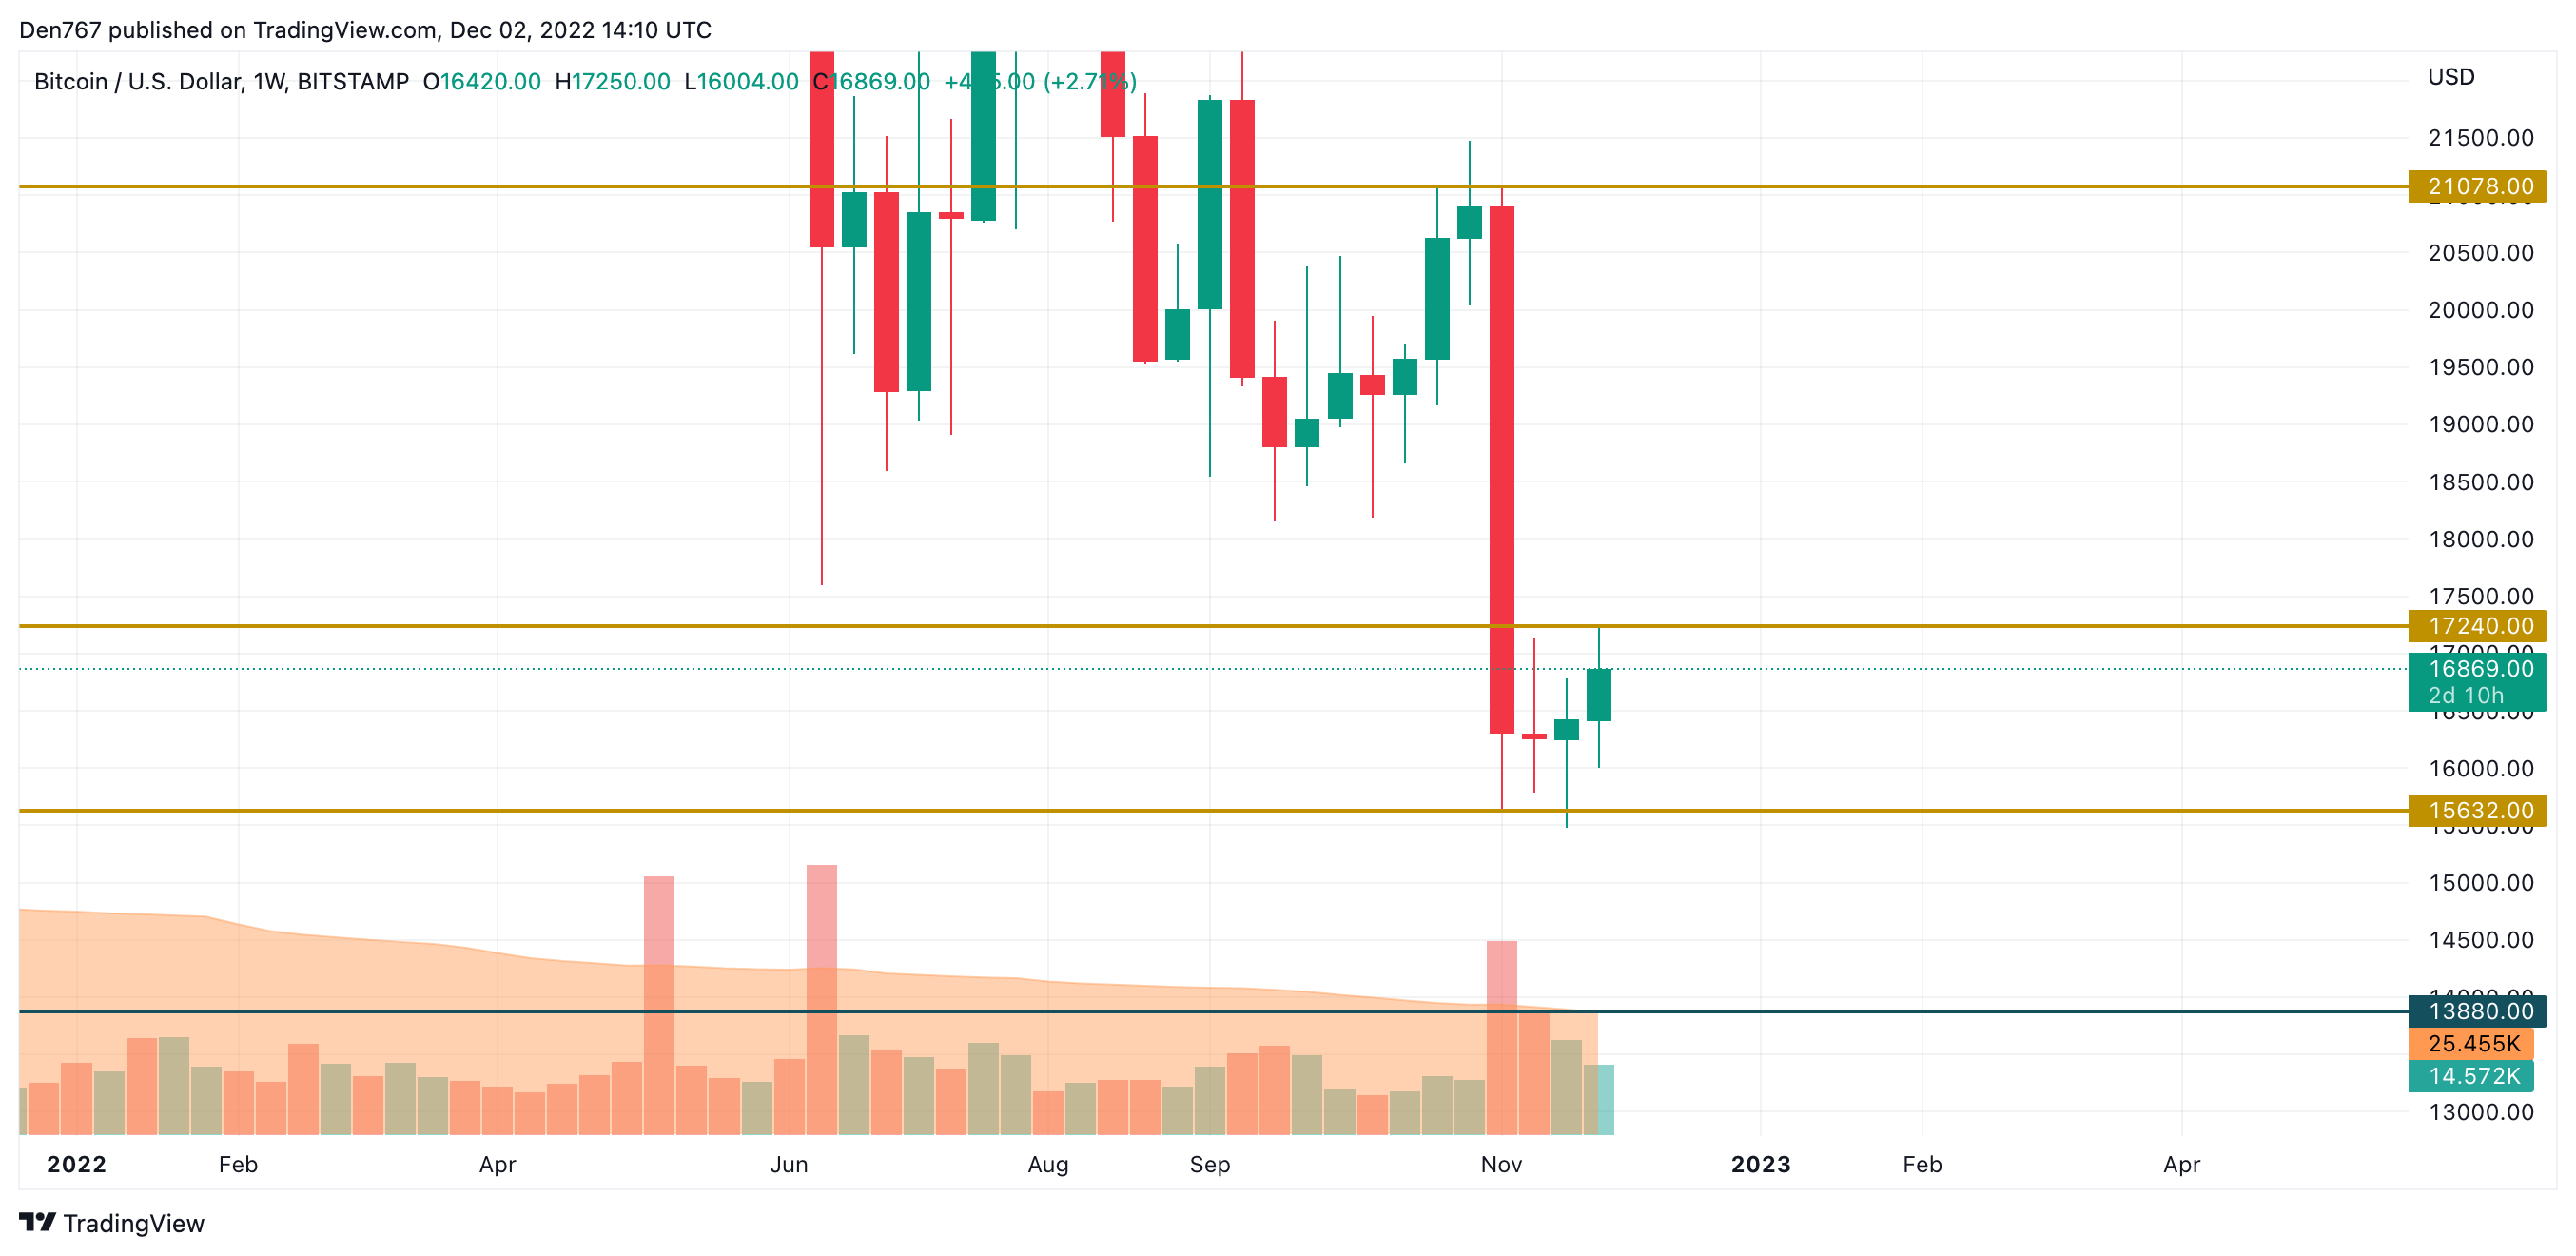
From the midterm point of view, Bitcoin (BTC) is about to close the candle above the previous one, which offers hope for a slight rise. At the moment, traders should pay attention to the $17,000 mark, the breakout of which can be a prerequisite for growth to $18,000.
Bitcoin is trading at $16,883 at press time.


