SHIB Price Analysis for November 2
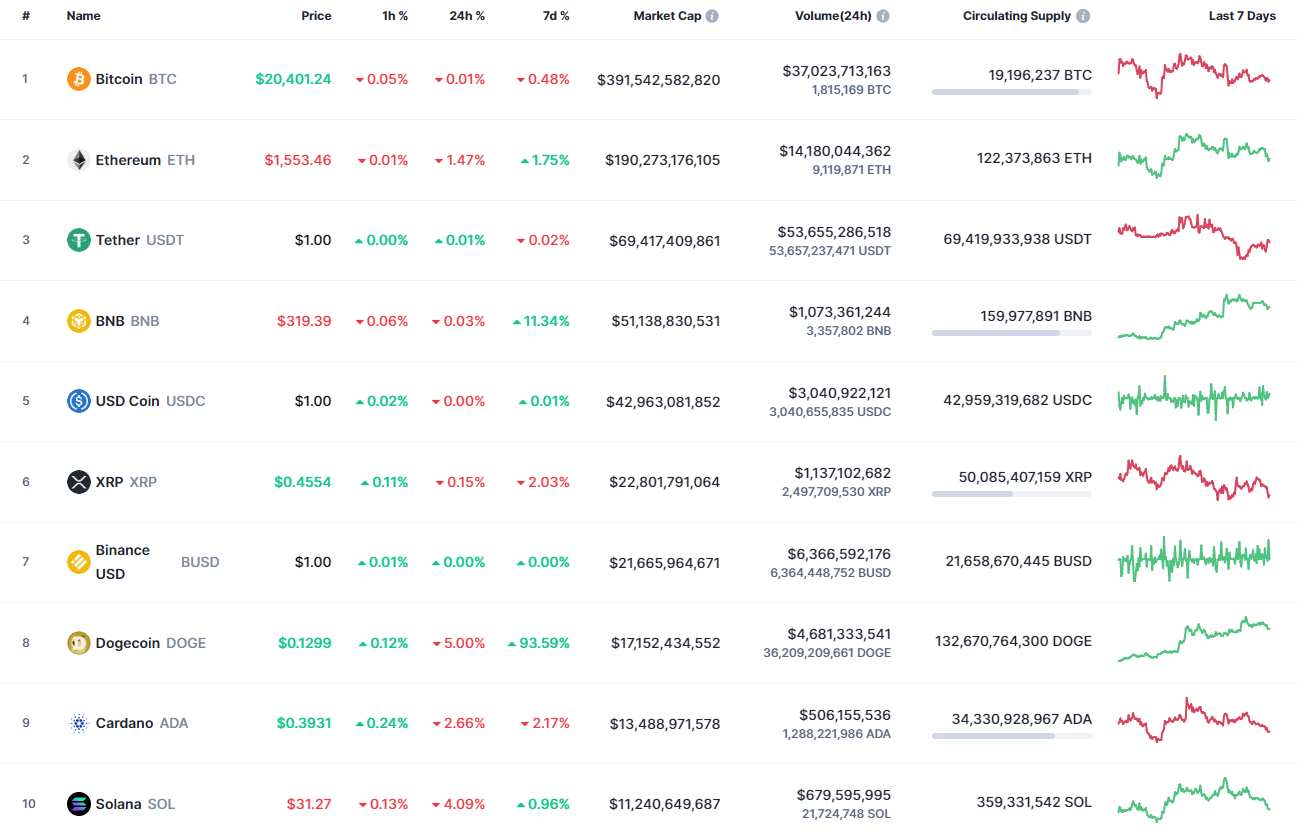
Bears have turned out to be more powerful than bulls, according to the CoinMarketCap ranking.

SHIB/USD
SHIB is one of the biggest losers today, falling by 5.55%.

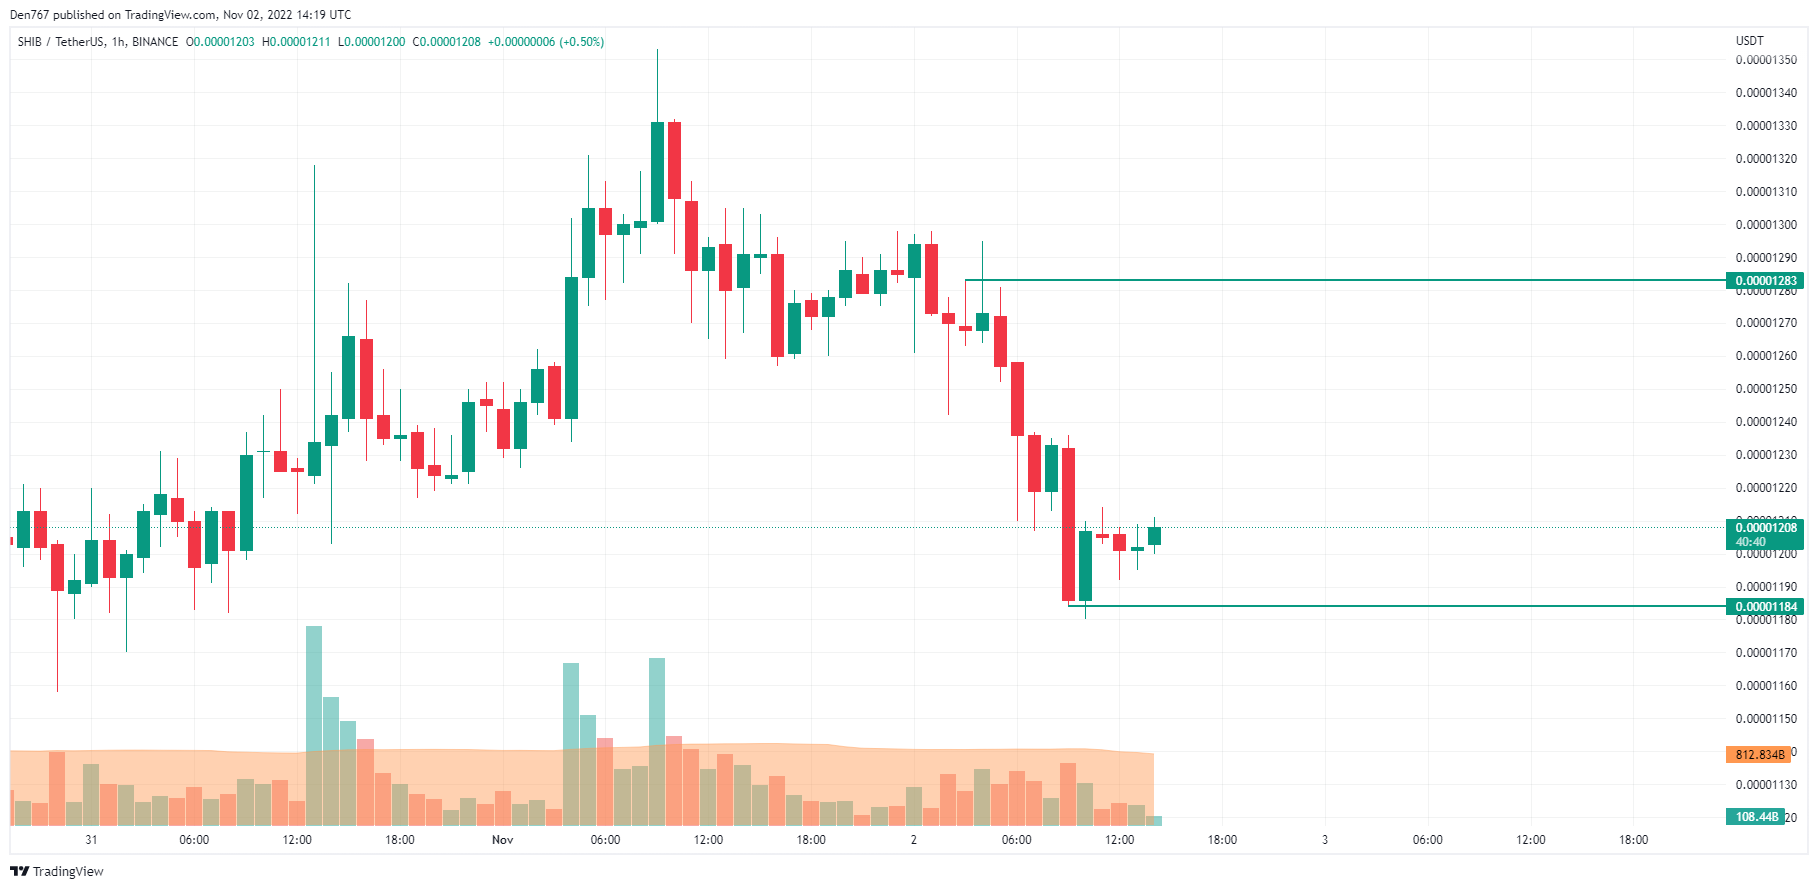
SHIB has made a false breakout of the hourly support level at $0.00001184. Until the price is above it, buyers have a chance to seize the initiative. In this case, the growth can lead to the test of the resistance zone at $0.00001280.

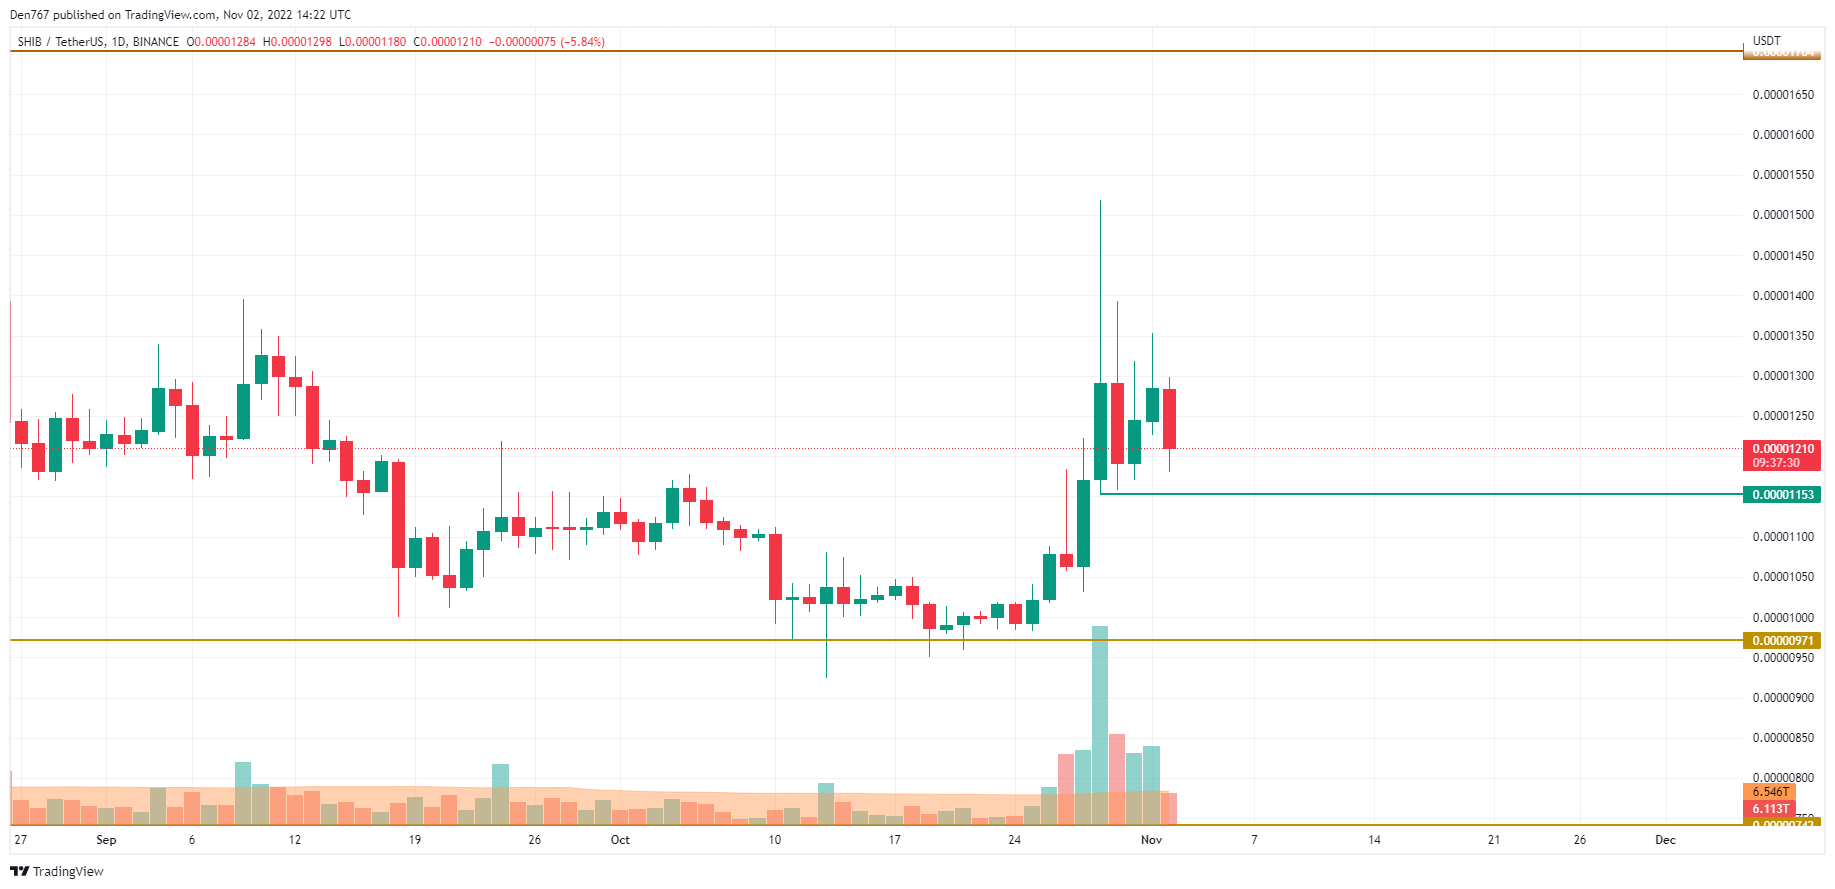
On the daily chart, the situation is the opposite. If the candle closes below yesterday’s low at $0.00001226, one can expect a quick test of the nearest support level at $0.00001153. Thus, the volume is low, which means that buyers are not powerful enough to buy at the current levels.

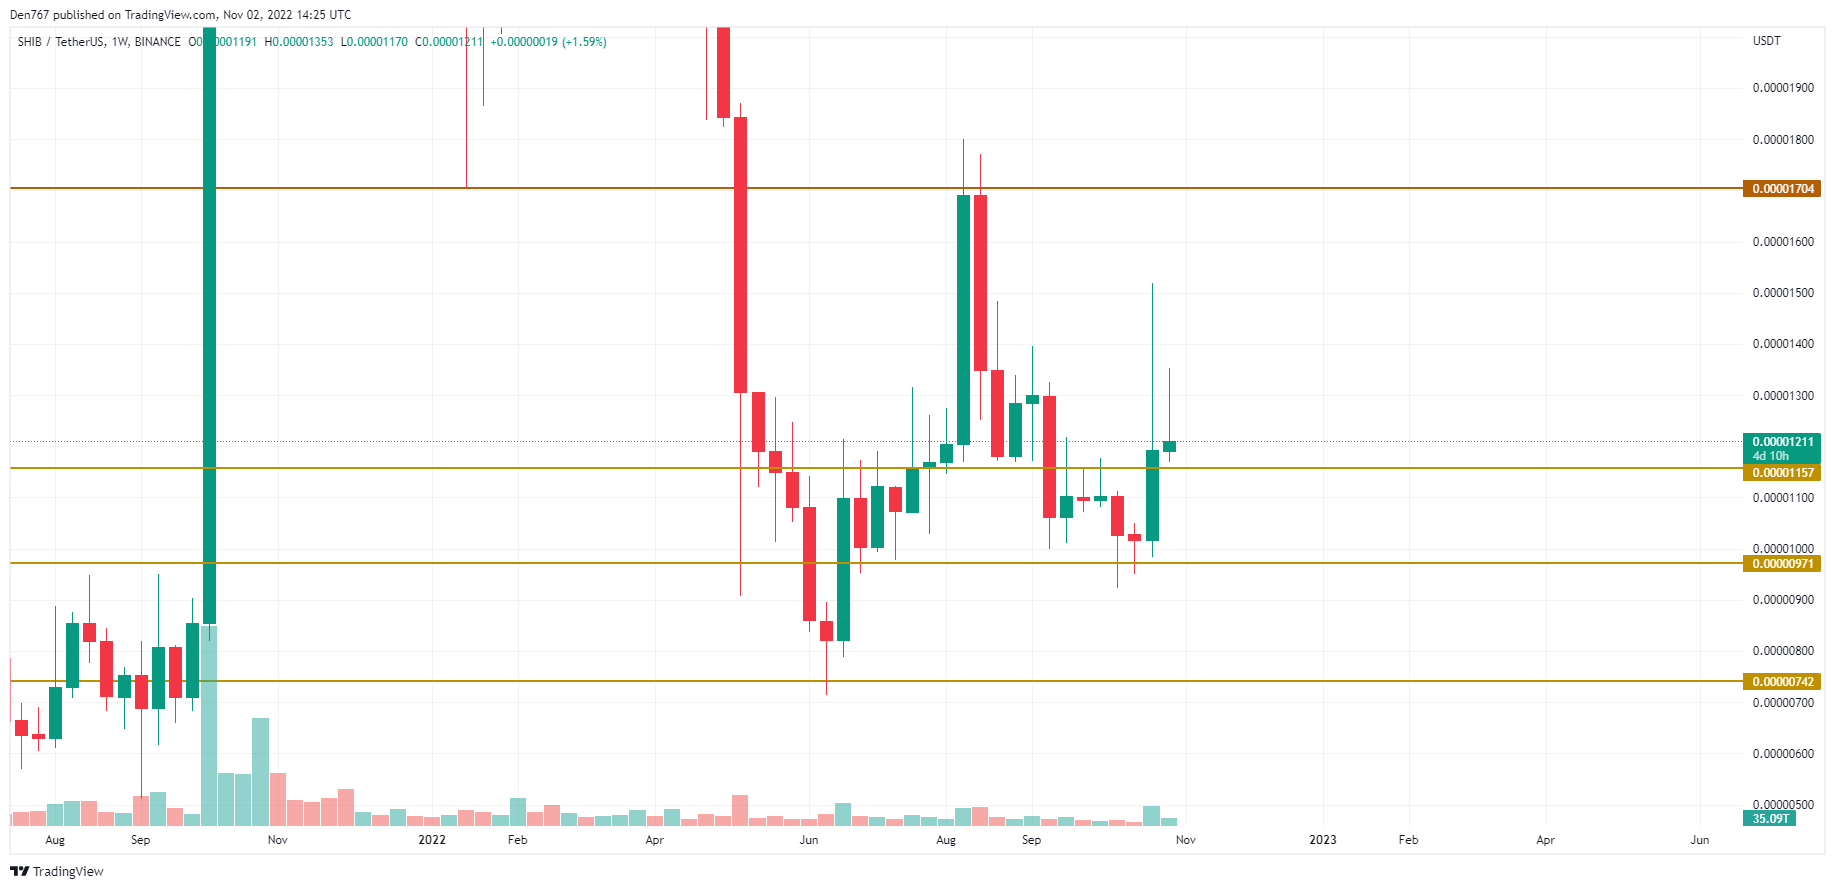
On the bigger chart, the situation is also more bearish than bullish. At the moment, one should pay attention to the support level at $0.00001157.
If a breakout occurs, the impulse may lead to a drop to the $0.000011 zone shortly.
SHIB is trading at $0.00001206 at press time.


