Chainlink: Why a whale rescue mission may not be enough to save LINK
Chainlink [LINK] almost hit the $8 mark as the smart contracts network rallied impressively over the weekend. According to Santiment, the increase might have been impossible if not for the intervention of its whales.
The on-chain analytic platform also reported that unusually active Chainlink whales made about thirty-three $1 million transactions. Santiment also stated that these transactions were the highest LINK had recorded since a similar situation on 27 June.
🔗🐳 #Chainlink whales have gotten quite active this weekend as market prices have teased the $8 level a few times. Saturday saw 33 different $LINK transactions exceeding a value of $1 million. This was the highest whale activity day since June 27th. https://t.co/0eMNpYTDW2 pic.twitter.com/kaSkNdtLY6
— Santiment (@santimentfeed) October 30, 2022
Here’s AMBCrypto’s Price Prediction for Chainlink for 2023-2024
Is it whale season now?
Interestingly, it seemed that it was whales’ time to shine since Ethereum [ETH] sharks had their share of accumulating LINK recently. Regardless of the input, LINK struggled to hang on to the $7.8 region as it shredded 11% of its 24-hour trading volume.
This implied that the LINK investors accumulations were now being dropped off. As expected, this led to the loss of LINK’s attempt to reclaim $8. Despite the fall, was it still possible for LINK to aim for the milestone in the short term?
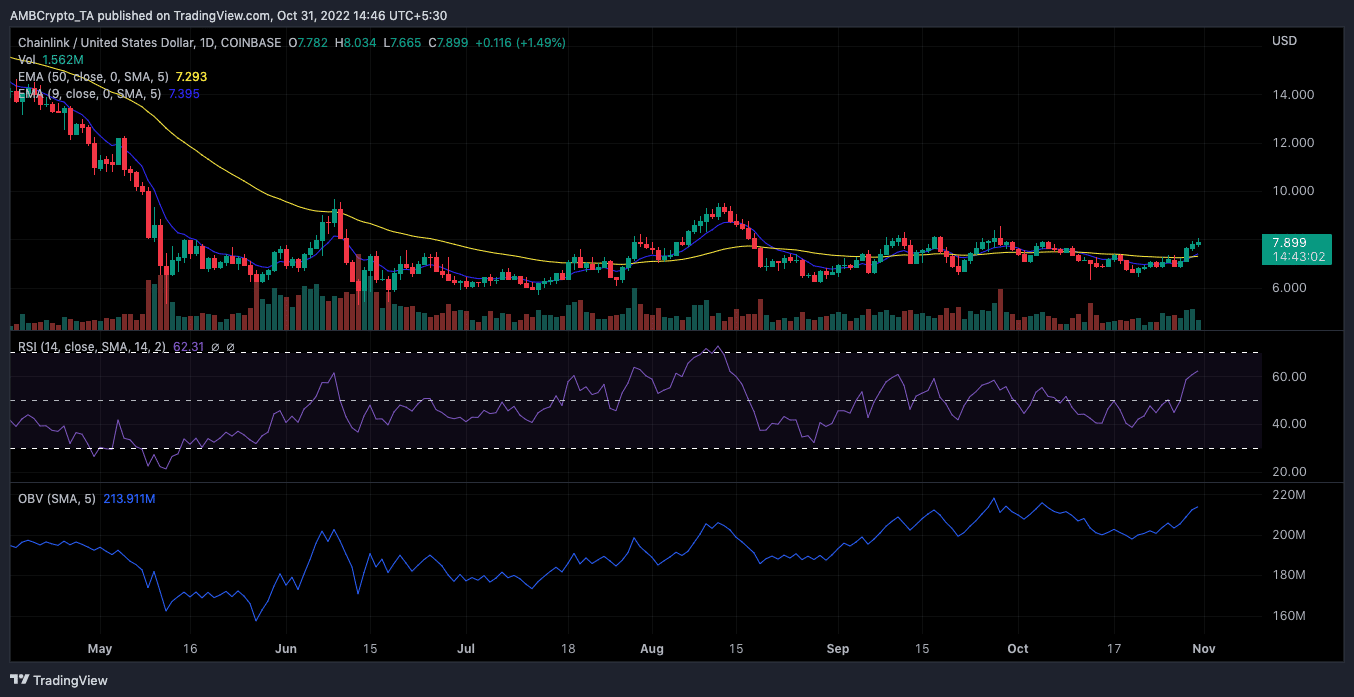
Based on indications from the Relative Strength Index (RSI), LINK might not be out of the bid to hit $8. The RSI, at 62.31, implied that there was good buying momentum. Hence, it was less likely to succumb to selling pressure, except the buyers intensified their accumulation to send the RSI above 70.
Despite the RSI state, the On-Balance-Volume (OBV) showed that the whale action might not have slowed down. This was because the OBV, being 213.91 million at press time, suggested increasing liquidity pumped into the LINK chain.
However, the Exponential Moving Average (EMA) differed from the indications agreed upon by the RSI and OBV. According to the four-hour chart, the 50 EMA (yellow) was slightly above the 20 EMA (blue). This increase implied that it might become difficult for LINK to sustain the current greens it was displaying.
Here’s the state on-chain
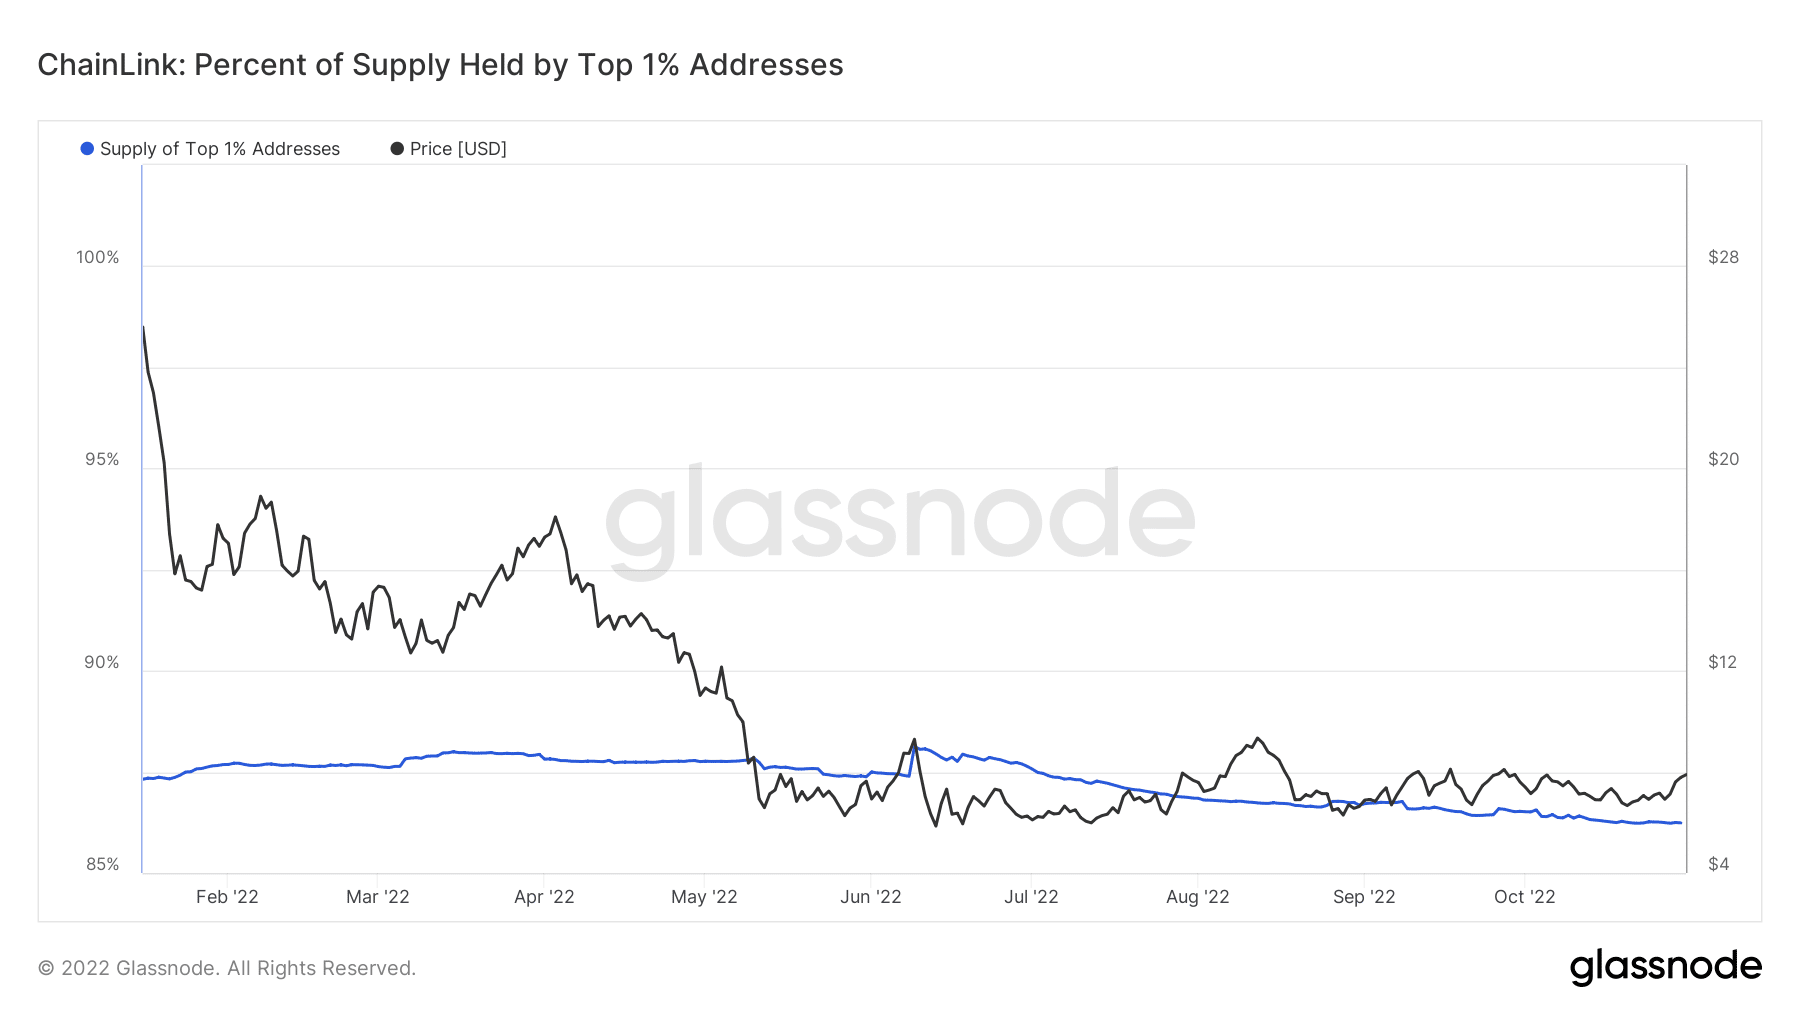
Although the possibility of LINK increasing per price was not all bleak, the top 1% of addresses were doing less to help its cause. According to Glassnode, Chainlink token supply percentage had decreased to 86.26% at the time of writing. This meant that investors holding LINK-related assets had ignored topping up. For some, they had dumped off some of the assets.
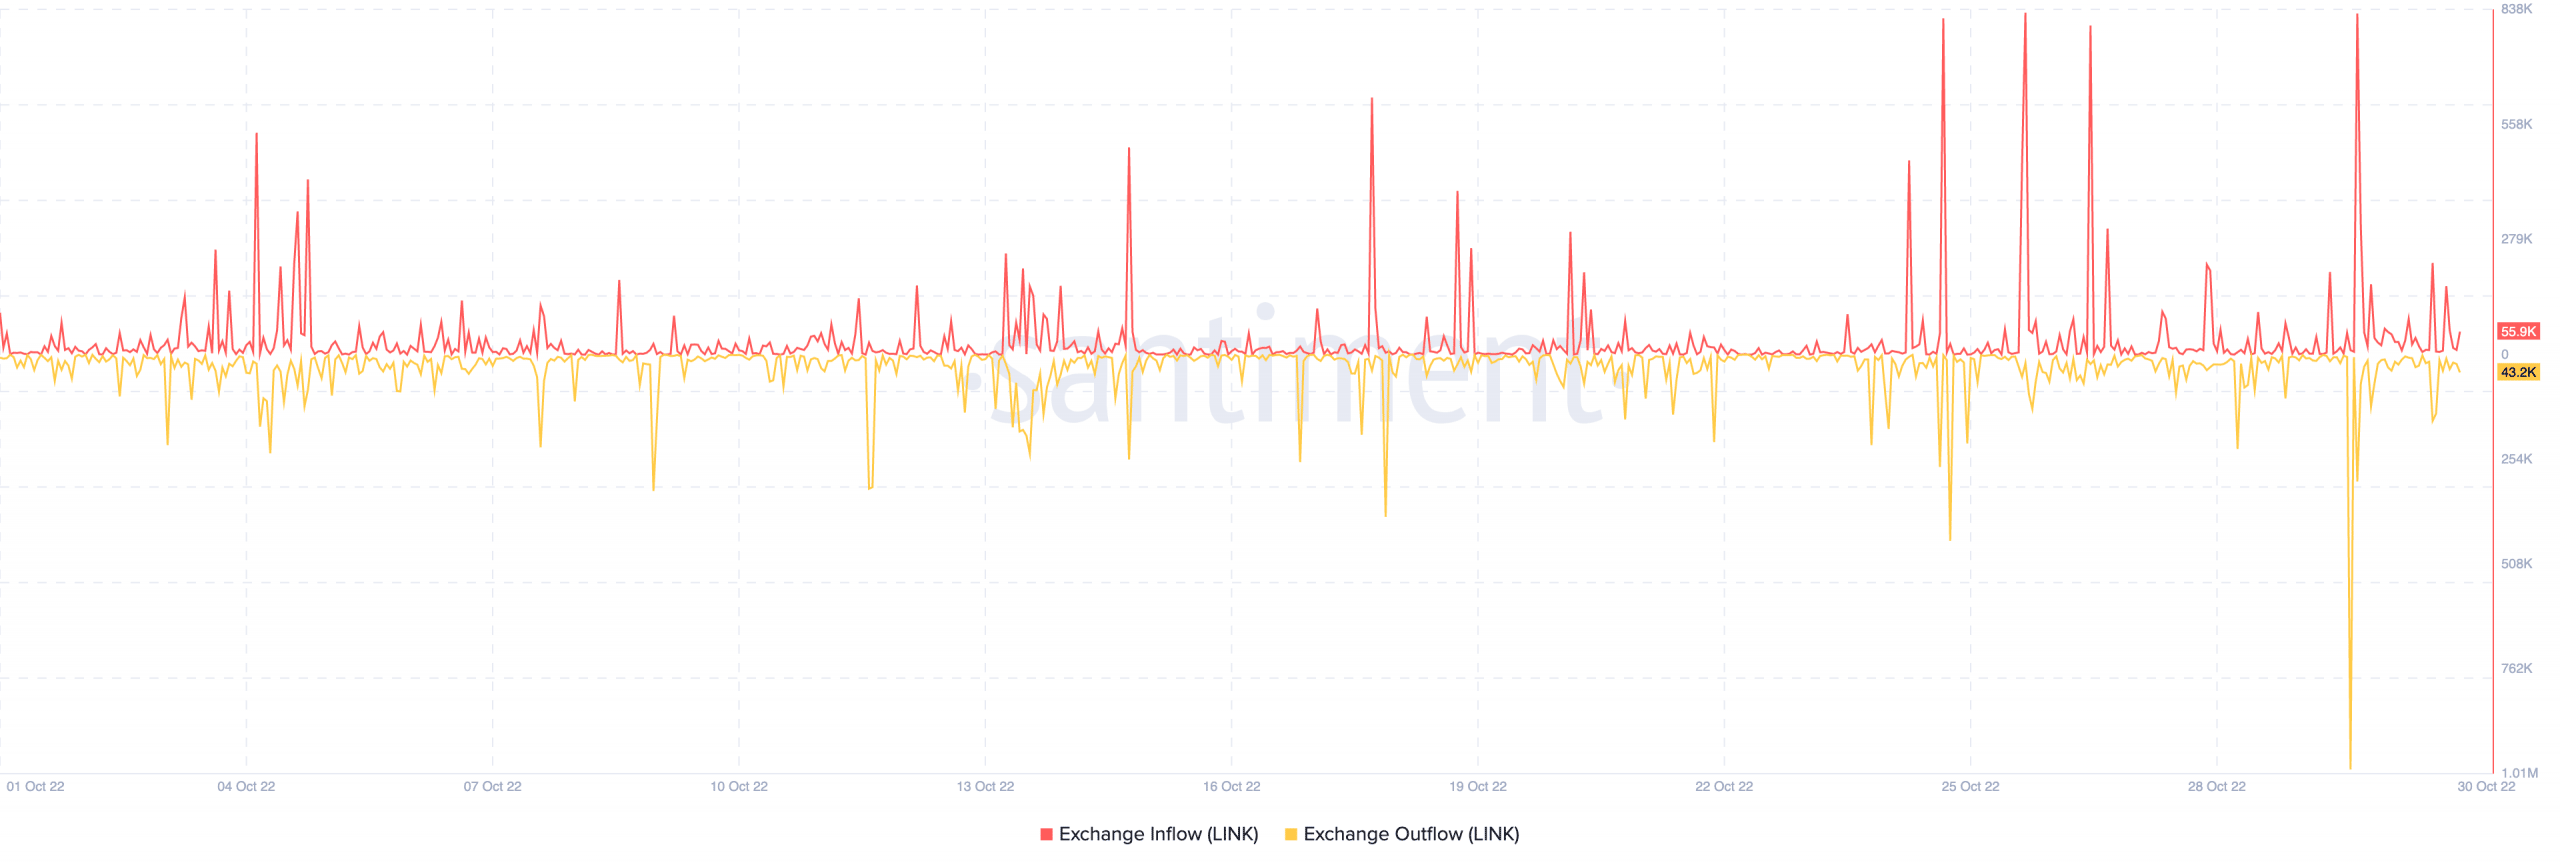
Per its exchange data, Santiment revealed that there had been more exchange inflow than outflow. At press time, the LINK exchange outflow was 43,200, while the inflow was 55,900. Since there was more inflow, it suggested that more investors were willing to sell off the profits from the previous week. If the trend remains the same, LINK might not escape a fall from the uptick.


