Here’s The Next Target for BTC if $21K Falls (Bitcoin Price Analysis)
Bitcoin’s bullish momentum is strong over the past couple of days, as the price has broken another significant dynamic resistance level to the upside. However, there is still work to do in order for the trend to be considered positive.
Technical Analysis
By: Edris
The Daily Chart
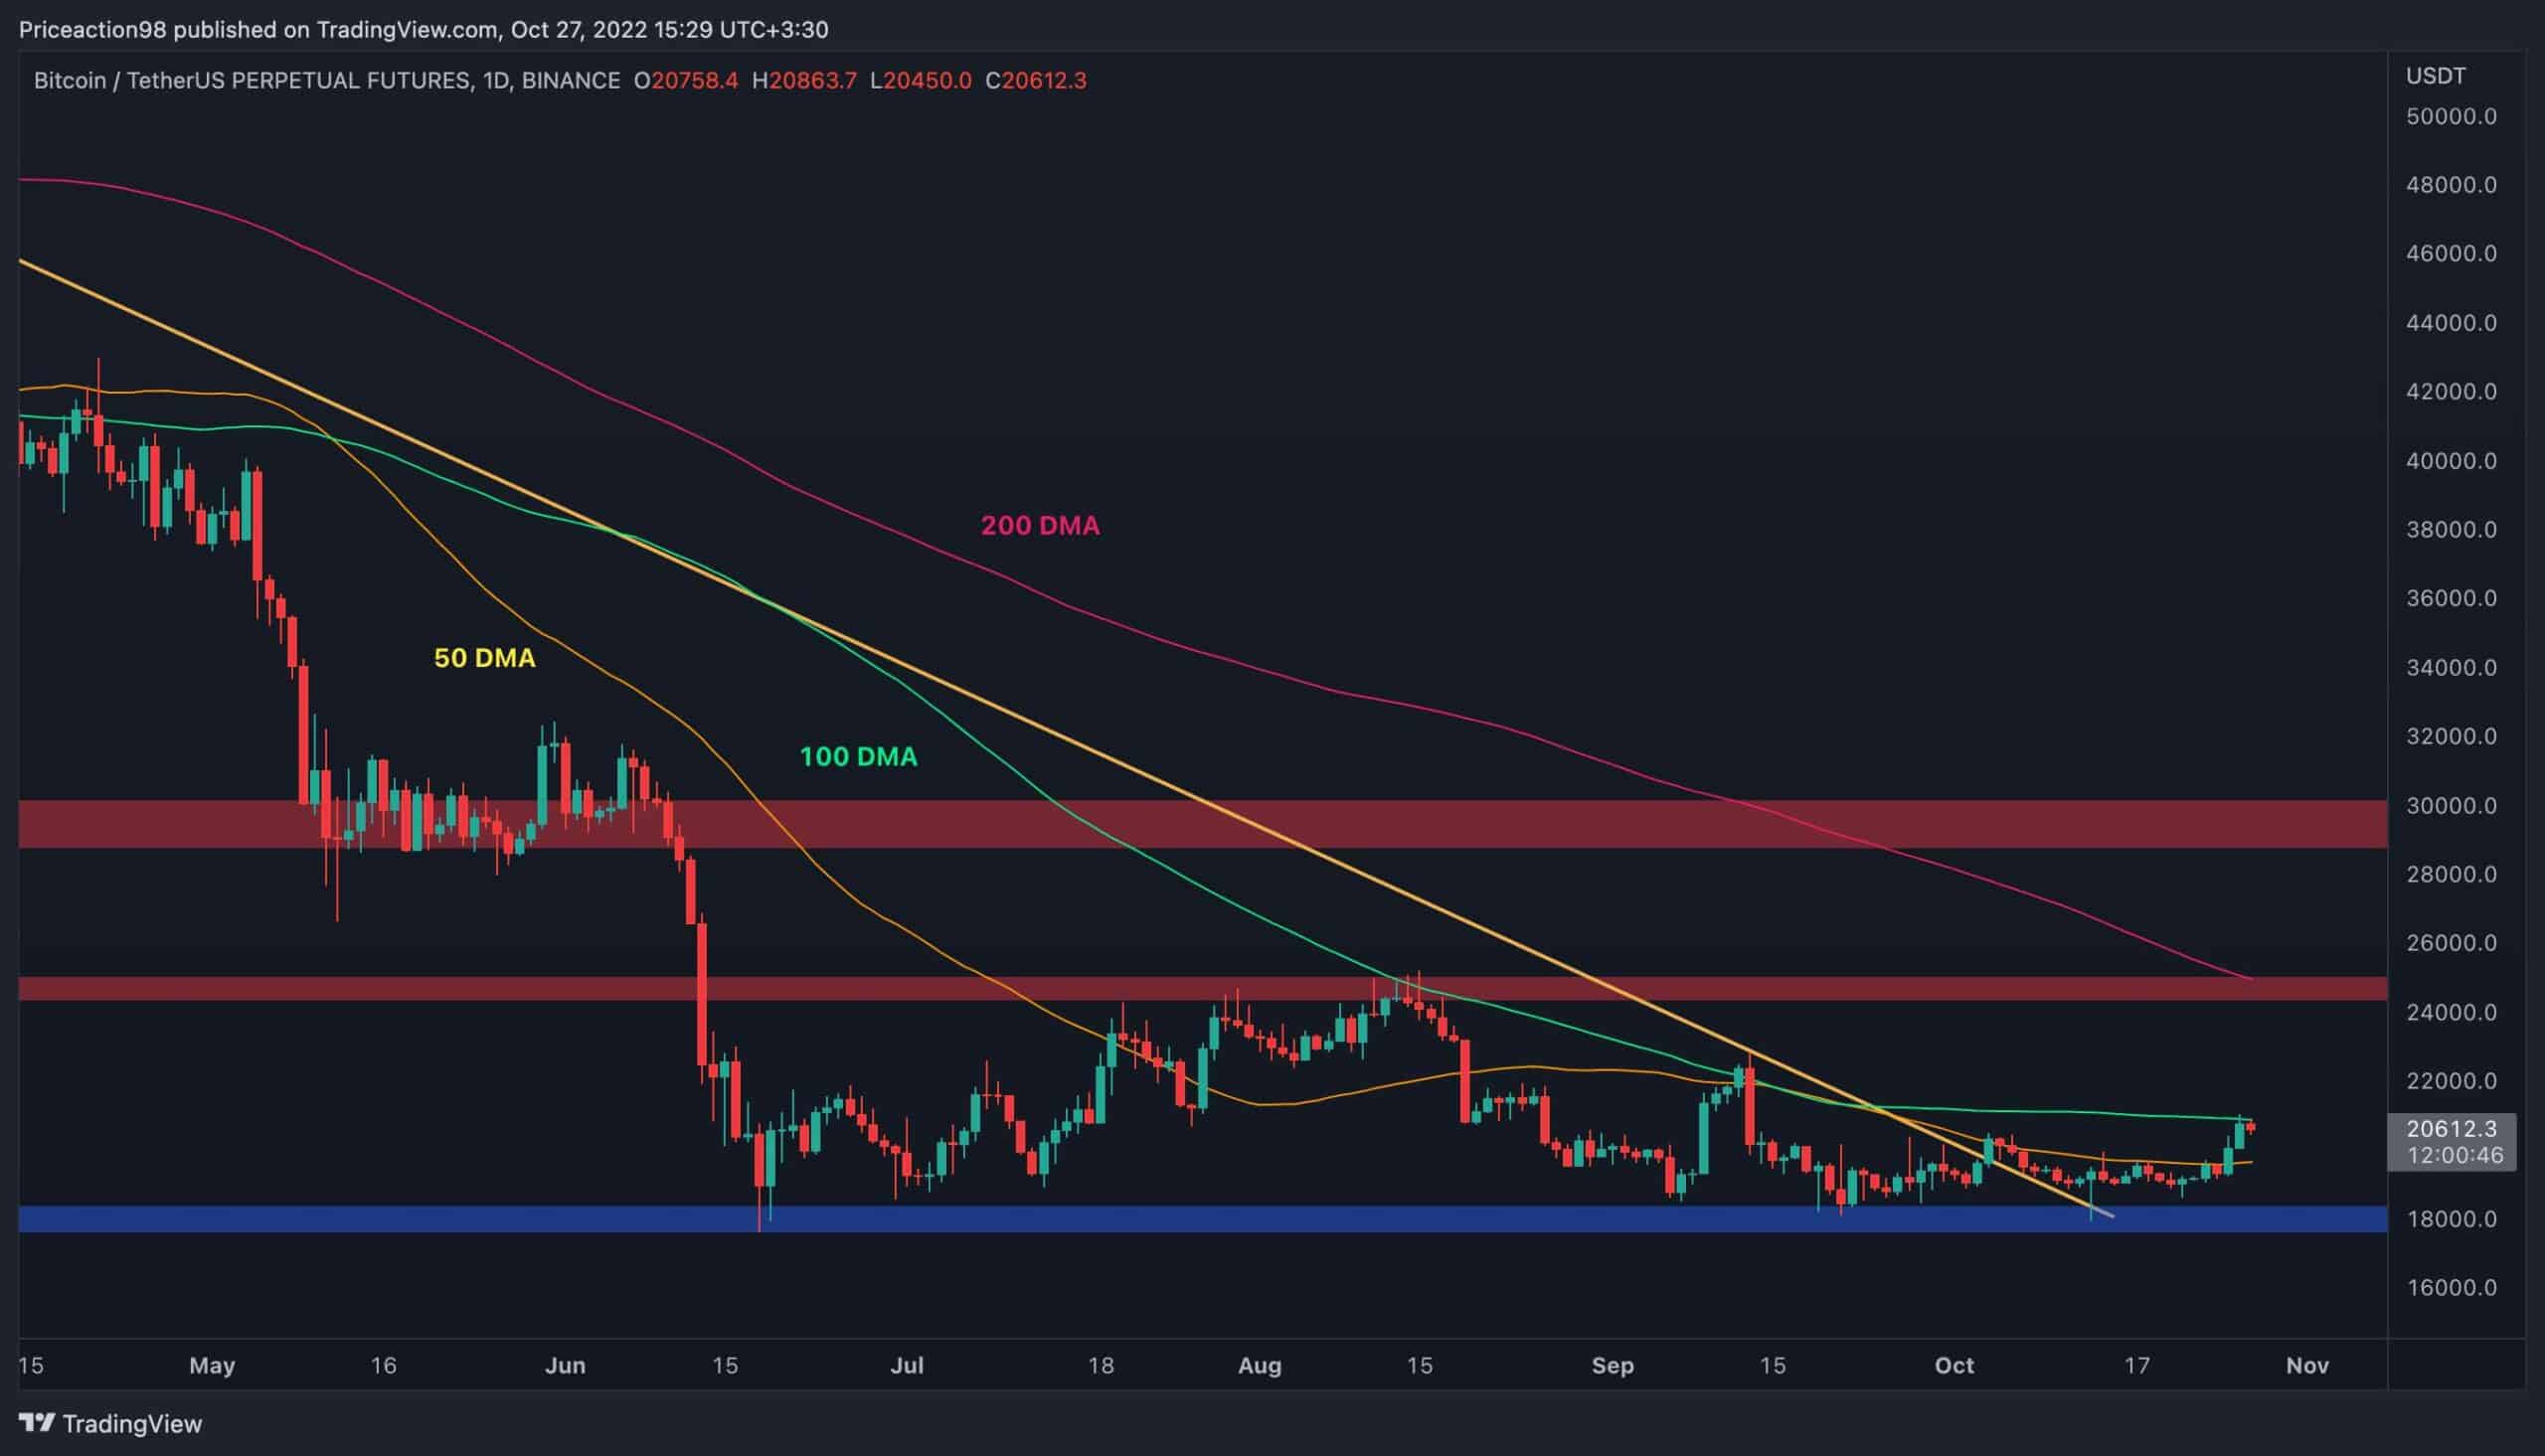
On the daily timeframe, the price has finally broken above the 50-day moving average after rebounding from the $18K support level. The broken bearish trendline has also acted as support, pushing BTC higher after multiple retests.
Currently, the price is wrestling with the 100-day moving average, and if a bullish breakout occurs, little could stand in the way of a price rally toward the $24K resistance level.
The market would need to push back above the $24K level and the 200-day moving average, located around $25K, to be considered bullish in the mid-term.
The 200-day moving average is one of the main indicators used to determine long-term trends and a bullish breakout above it may finally initiate a new bullish trend.
The 4-Hour Chart
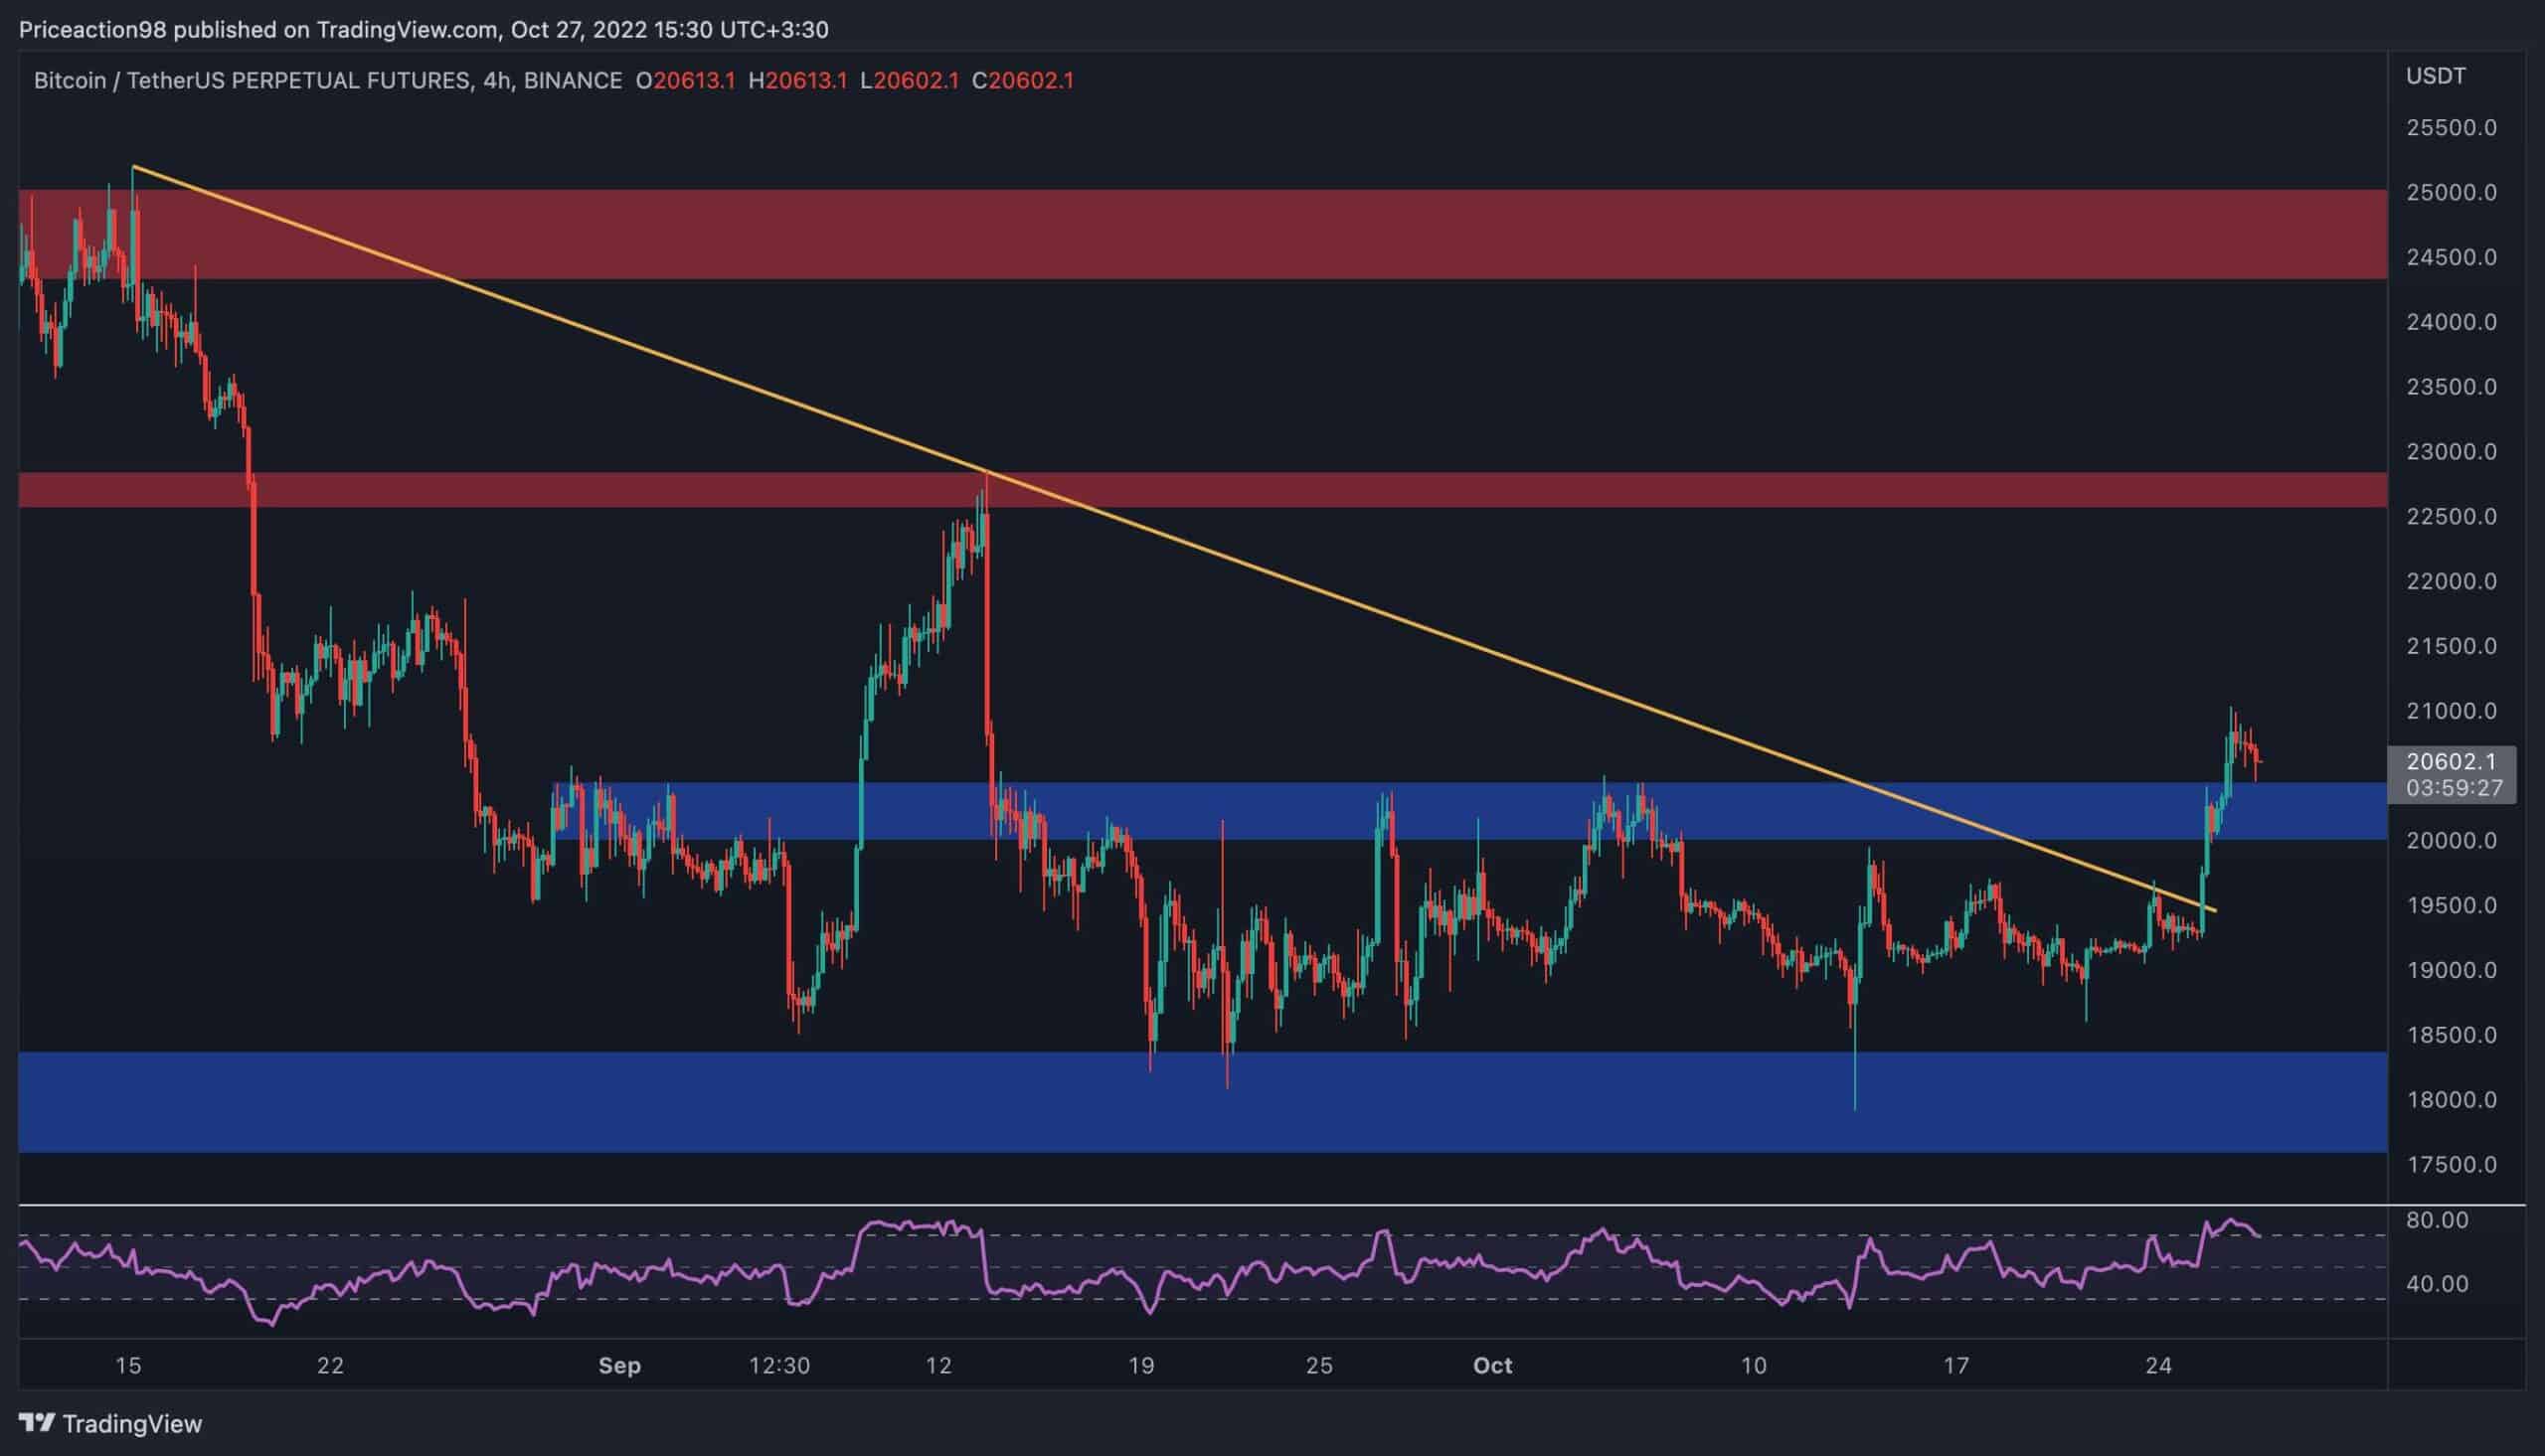
The 4-hour chart paints a clearer picture of potential short-term targets for Bitcoin. The price has finally broken above the $20K resistance level after weeks of consolidation, turning it into a potential support area.
The recent rally was launched after an impulsive bullish breakout from the bearish trendline, and the market is now trying to hold above $20K. If this level remains intact, a continuation toward $22,500 would be likely.
However, the RSI indicator should be closely monitored as it has been showing massive overbought signals, pointing to a potential reversal. In this case, the recent rally would be considered another bull trap and fake breakout, which would result in the price descending back toward the $18K support area.
Onchain Analysis
By Shayan
A bear market often lasts until retail investors capitulate and supply dries up, and once demand returns, it officially ends.
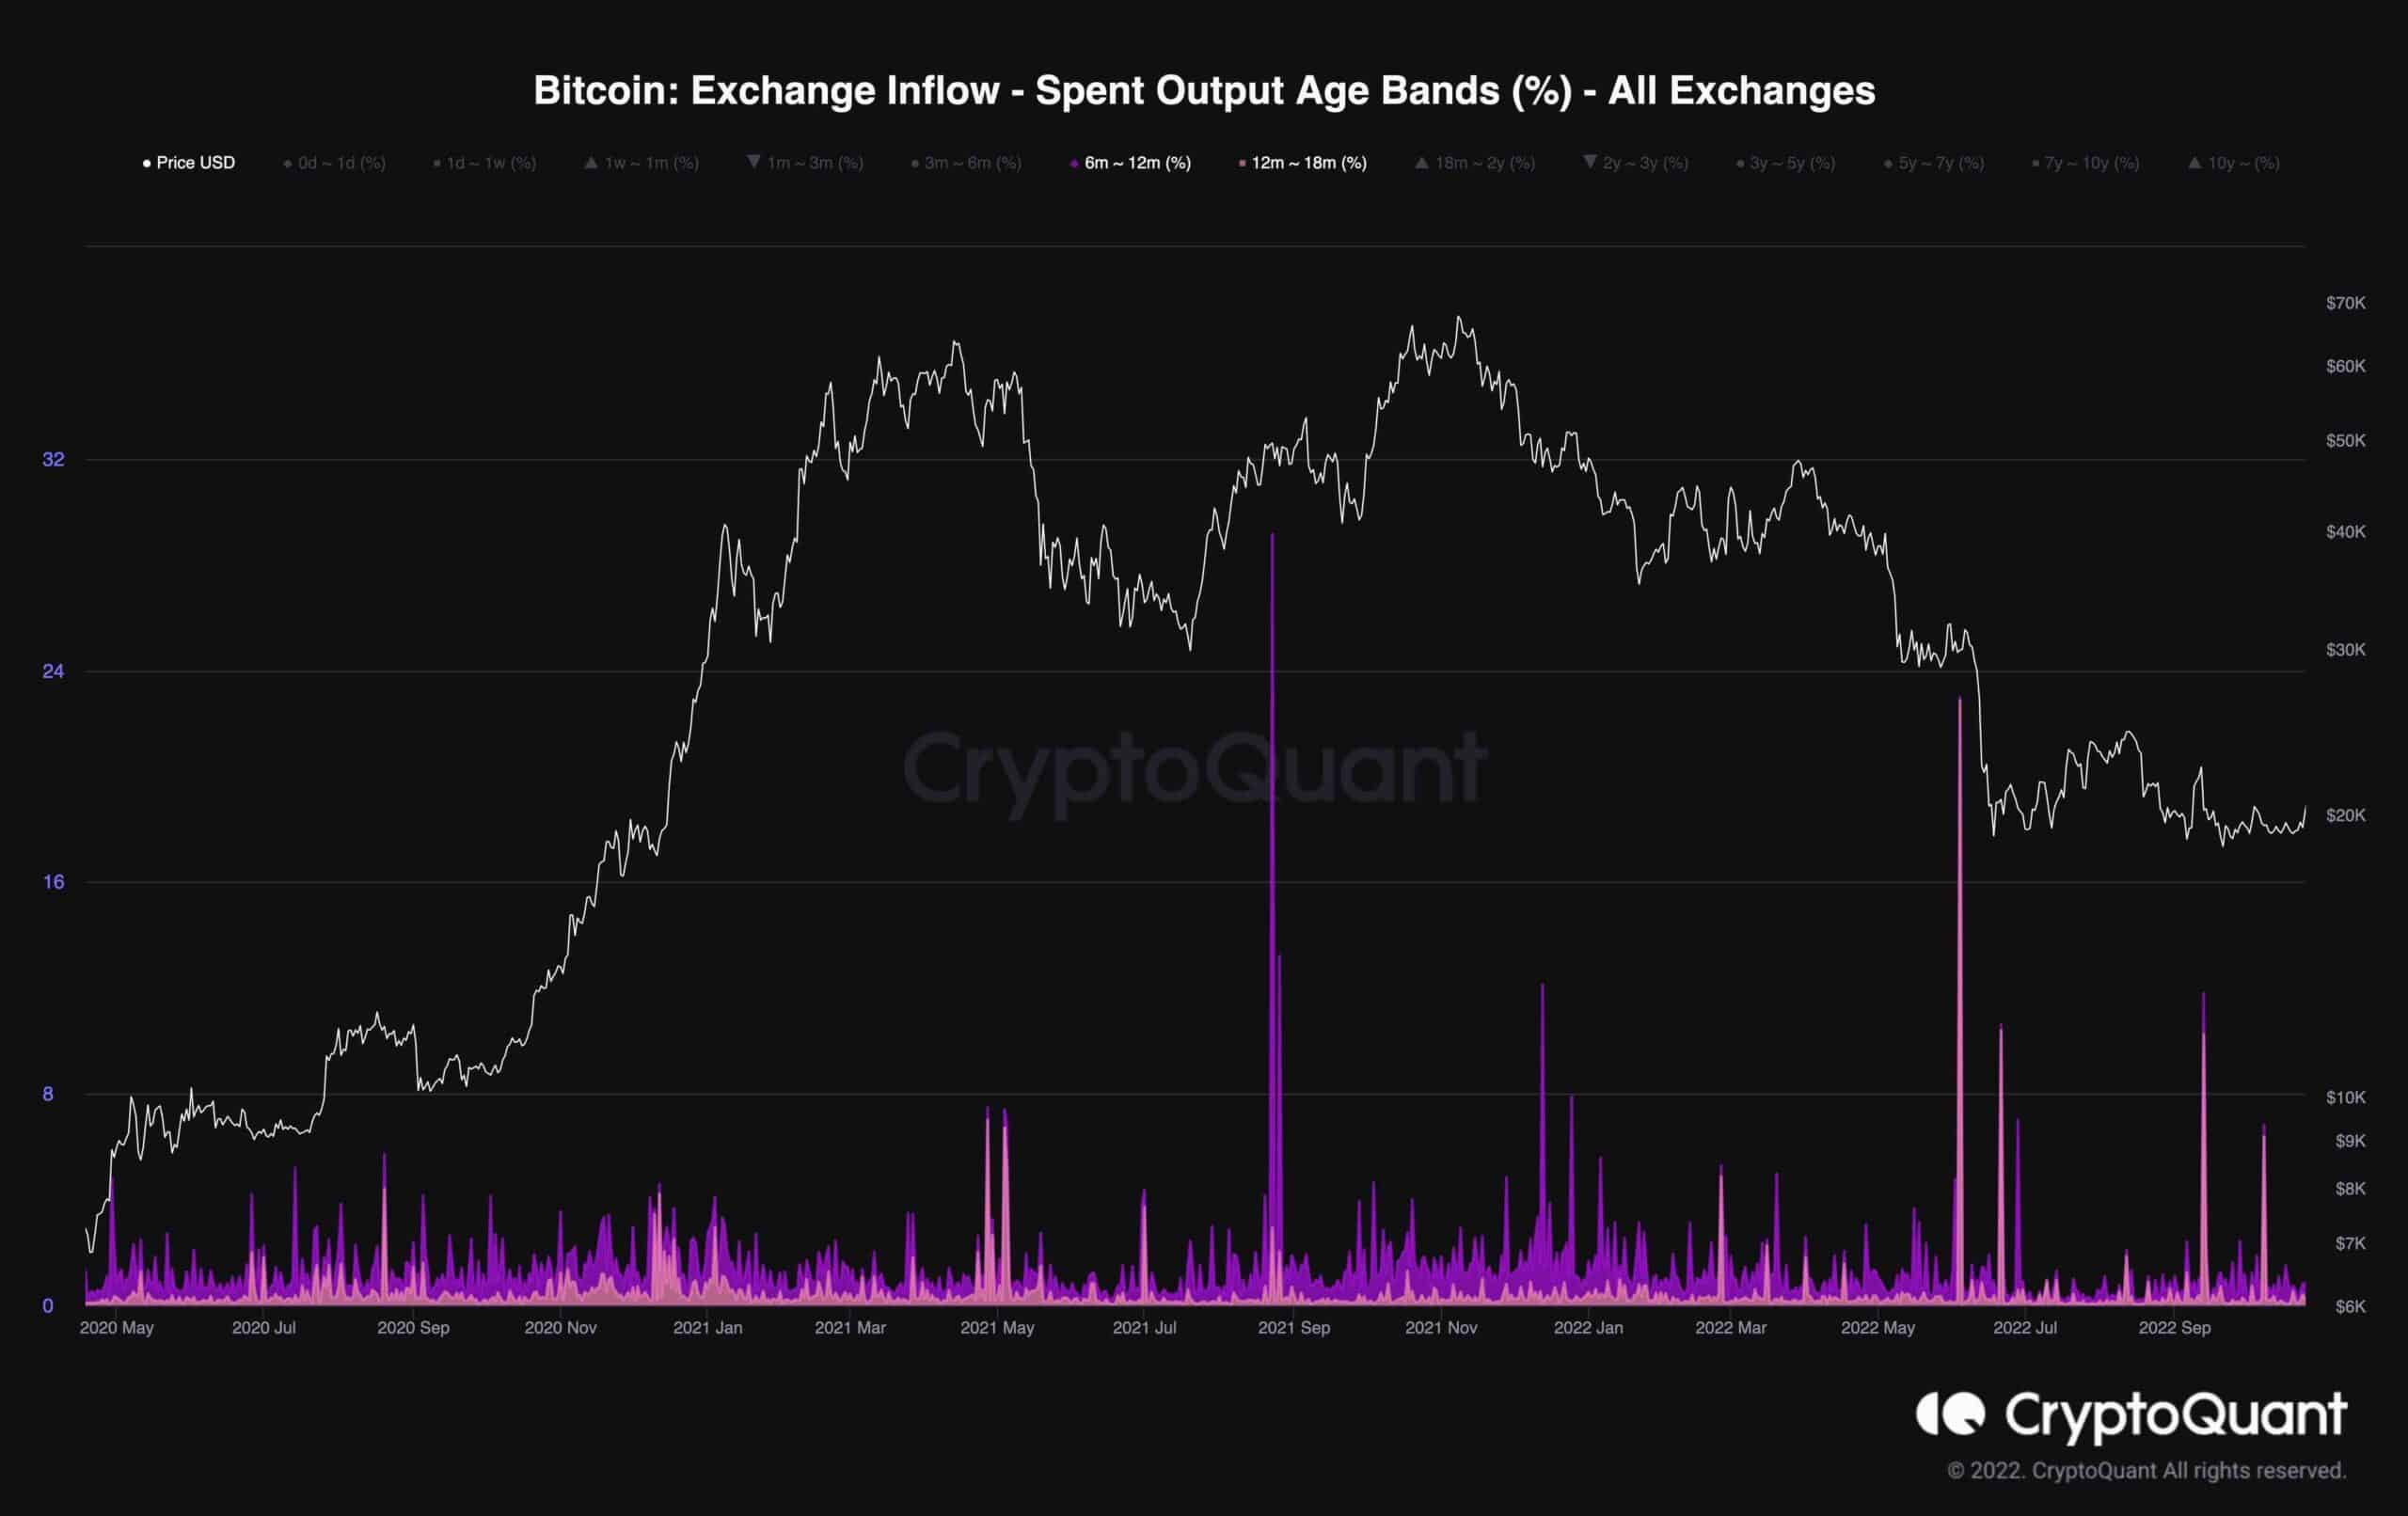
The Exchange Inflow SOAB metric, which indicates the age of coins being deposited and sold on the exchanges, is one of the most valuable metrics to gauge this trend. The chart pictured below clearly shows that coins between the ages of 6 and 18 months have recently been sold aggressively.
This outcome reveals that many investors who accumulated during the bull market and over the $30K threshold subsequently capitulated and sold their assets, realizing losses of almost 50%.
These capitulations frequently happen in the later stages of a bear market, suggesting that a bottom may be forming soon.
Binance Free $100 (Exclusive): Use this link to register and receive $100 free and 10% off fees on Binance Futures first month (terms).
PrimeXBT Special Offer: Use this link to register & enter POTATO50 code to receive up to $7,000 on your deposits.
Disclaimer: Information found on CryptoPotato is those of writers quoted. It does not represent the opinions of CryptoPotato on whether to buy, sell, or hold any investments. You are advised to conduct your own research before making any investment decisions. Use provided information at your own risk. See Disclaimer for more information.
Cryptocurrency charts by TradingView.


