Bitcoin (BTC) Price Analysis for October 24
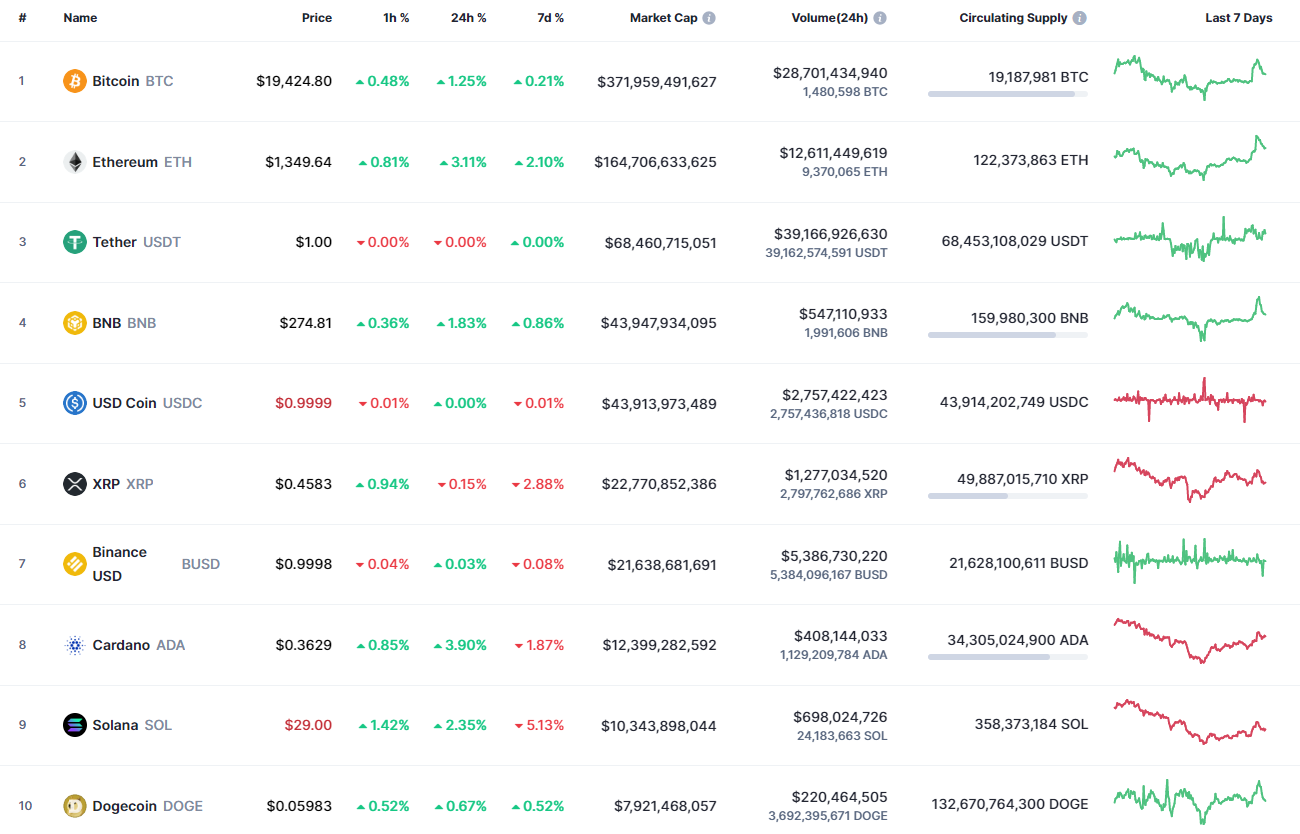
Most of the coins have followed the bounce back of Bitcoin (BTC), except for XRP, whose rate has declined by 0.15%.

BTC/USD
The rate of Bitcoin (BTC) has risen by 1.34% over the last 24 hours.

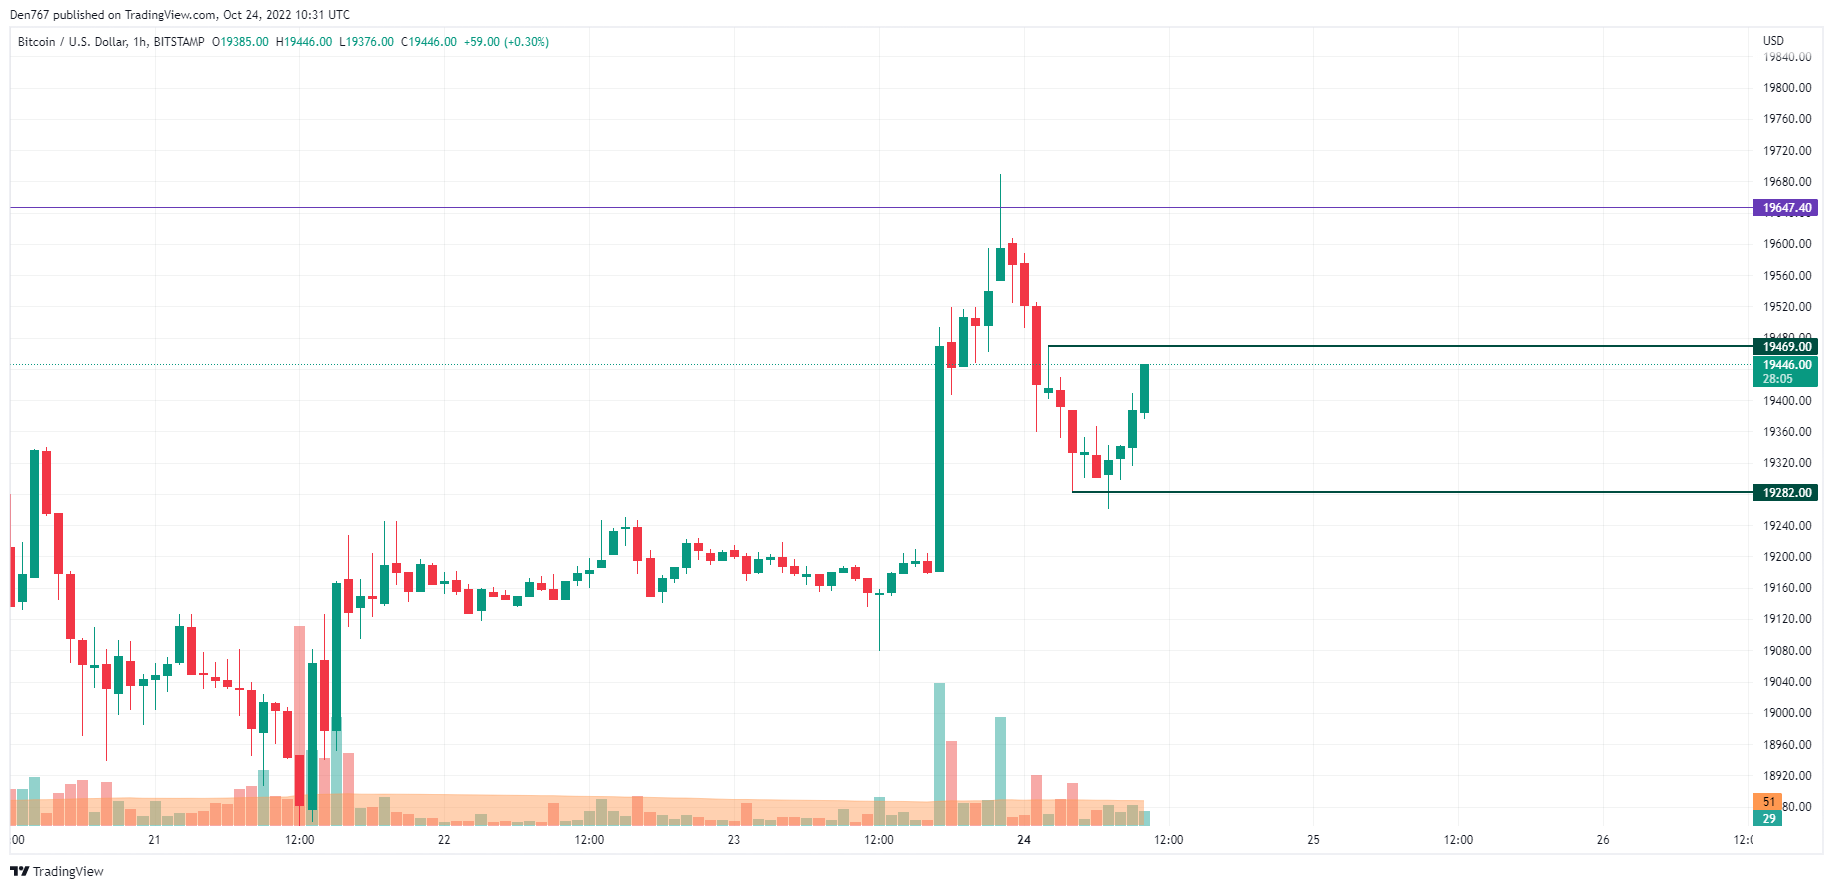
On the hourly chart, Bitcoin (BTC) has formed the support level at $19,282 with the false breakout. At the moment, the rate is on its way to the local resistance at $19,469. If buyers hold the gained initiative, the upward move may continue to the $19,500-$19,600 zone.

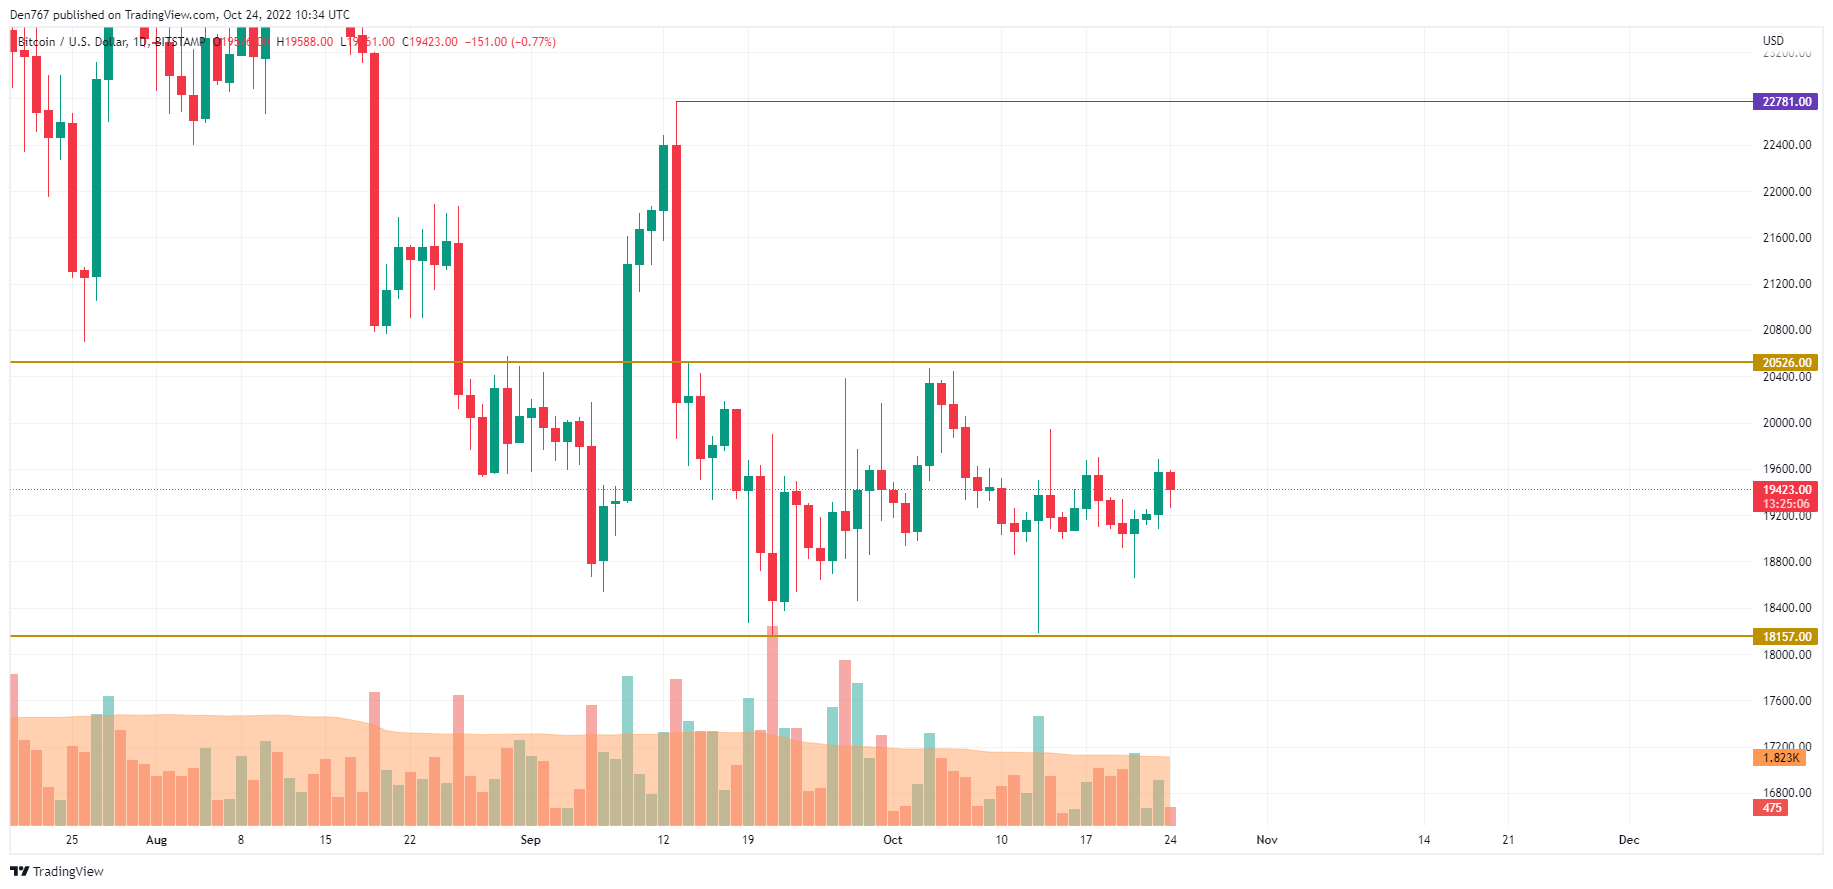
On the bigger time frame, the accumulation period continues as the price has reached neither the support level nor the resistance yet.
If today’s candle closes above the $19,200 mark, the chances for growth to the vital $20,000 area will rise.

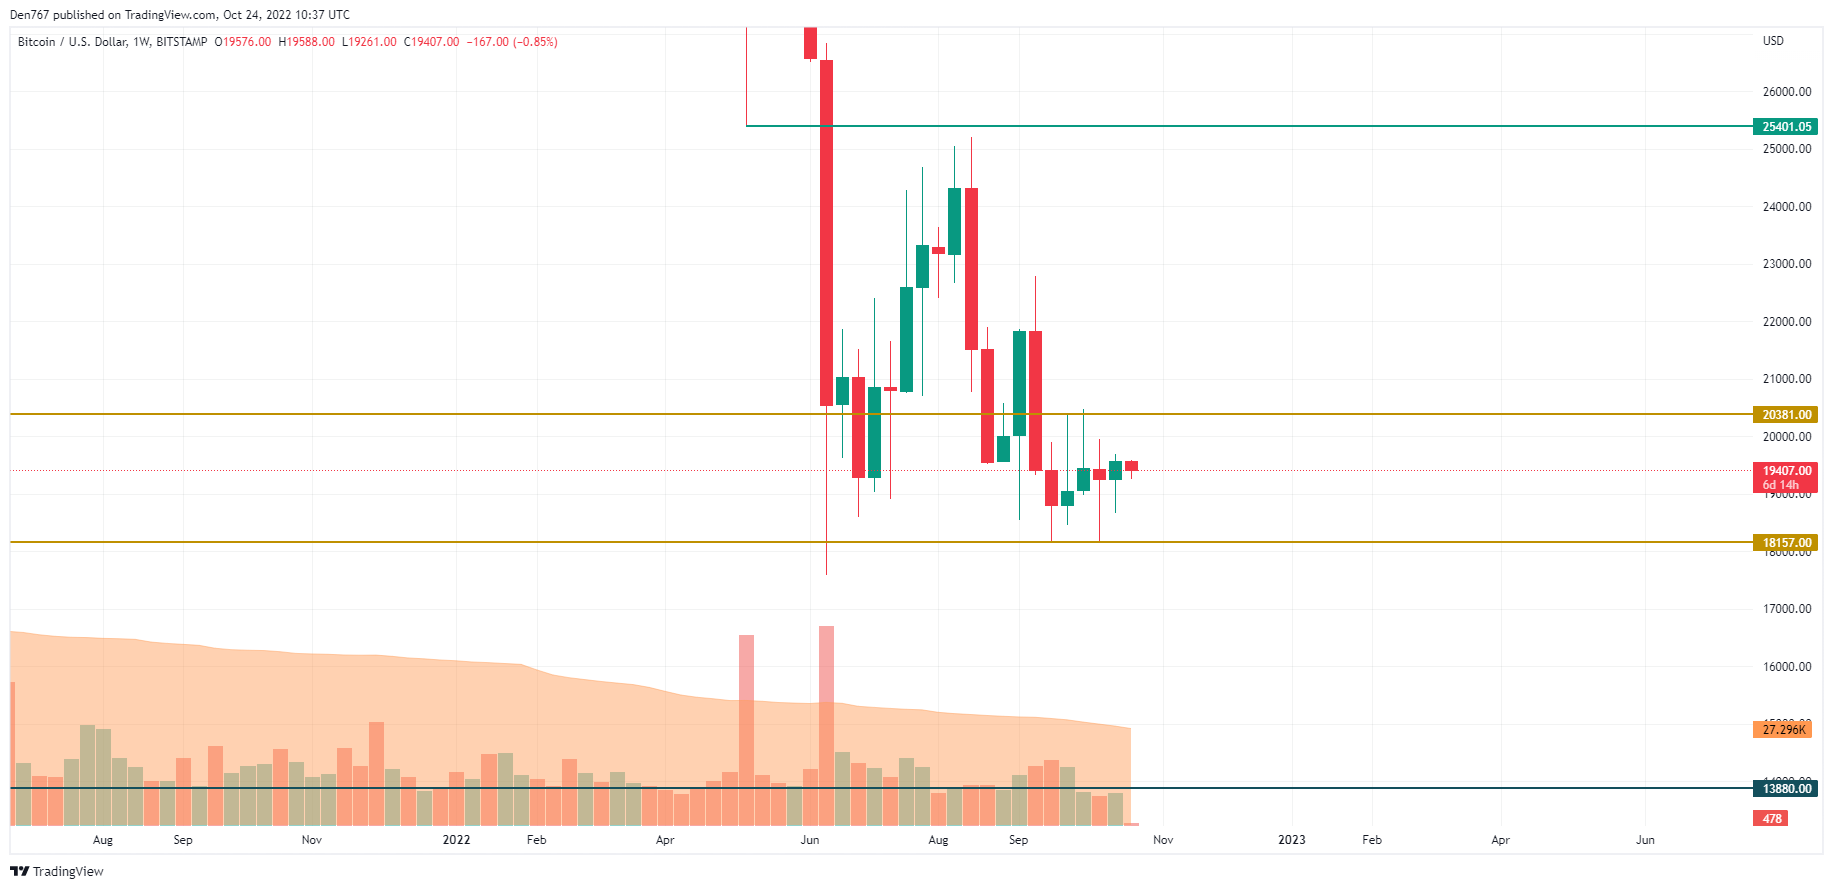
A similar picture is on the weekly chart as the volume keeps going down. If the price does not go below $19,000 and bulls continue the rise of the previous week, the main cryptocurrency might enter a bull run, which can lead to the test of the nearest resistance at $20,381 next month.
Bitcoin is trading at $19,412 at press time.