Polkadot (DOT) Price Analysis for October 22
Disclaimer: The opinion expressed here is not investment advice – it is provided for informational purposes only. It does not necessarily reflect the opinion of U.Today. Every investment and all trading involves risk, so you should always perform your own research prior to making decisions. We do not recommend investing money you cannot afford to lose.
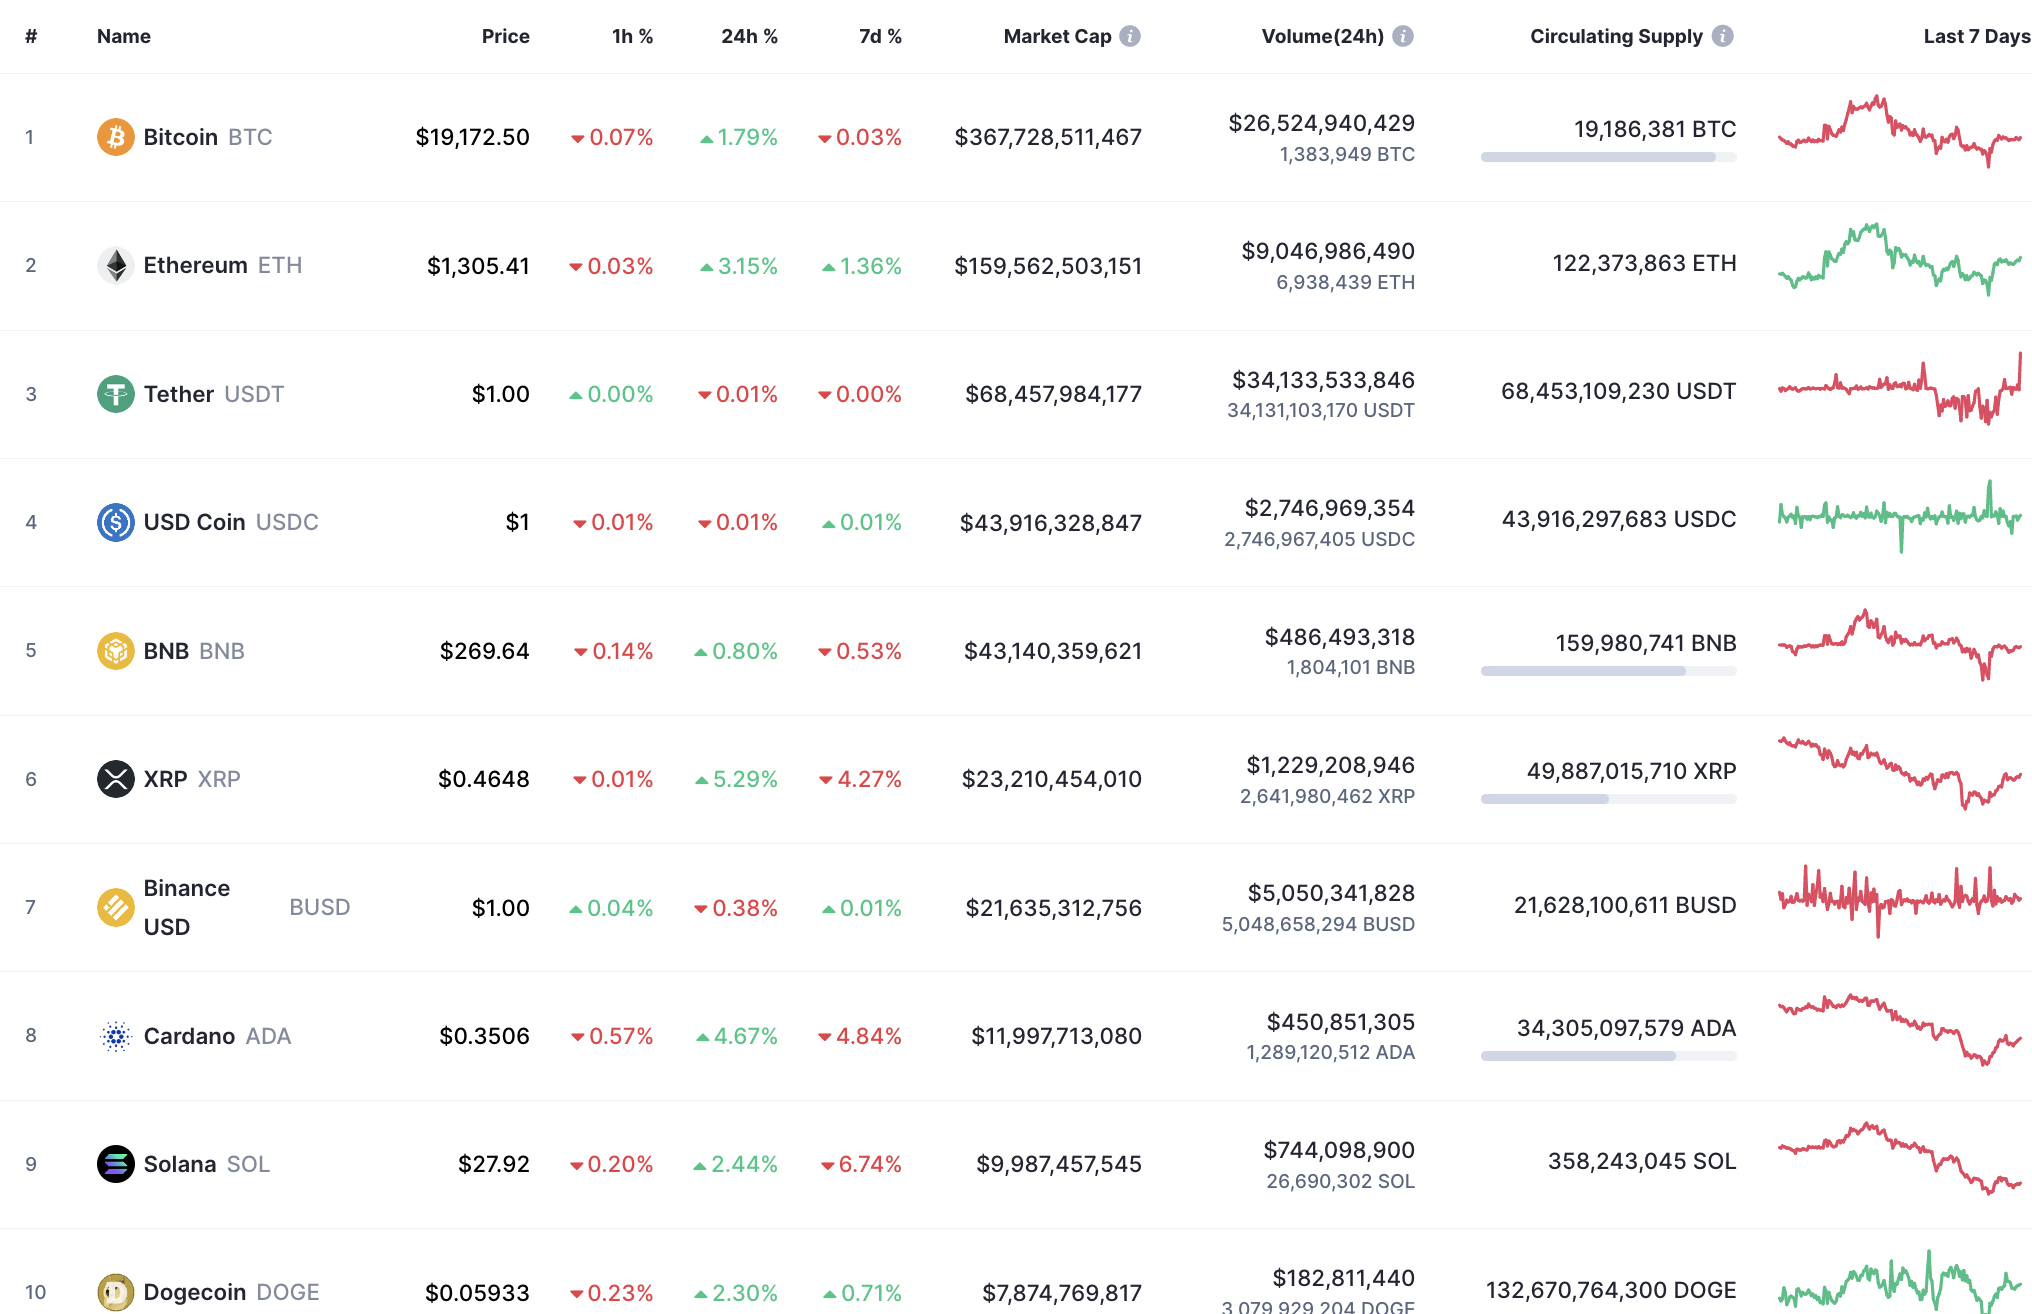
Bulls remain powerful, according to CoinMarketCap ranking.

DOT/USD
The Polkadot (DOT) rate has almost not changed since yesterday and has only grown by 0.46%.

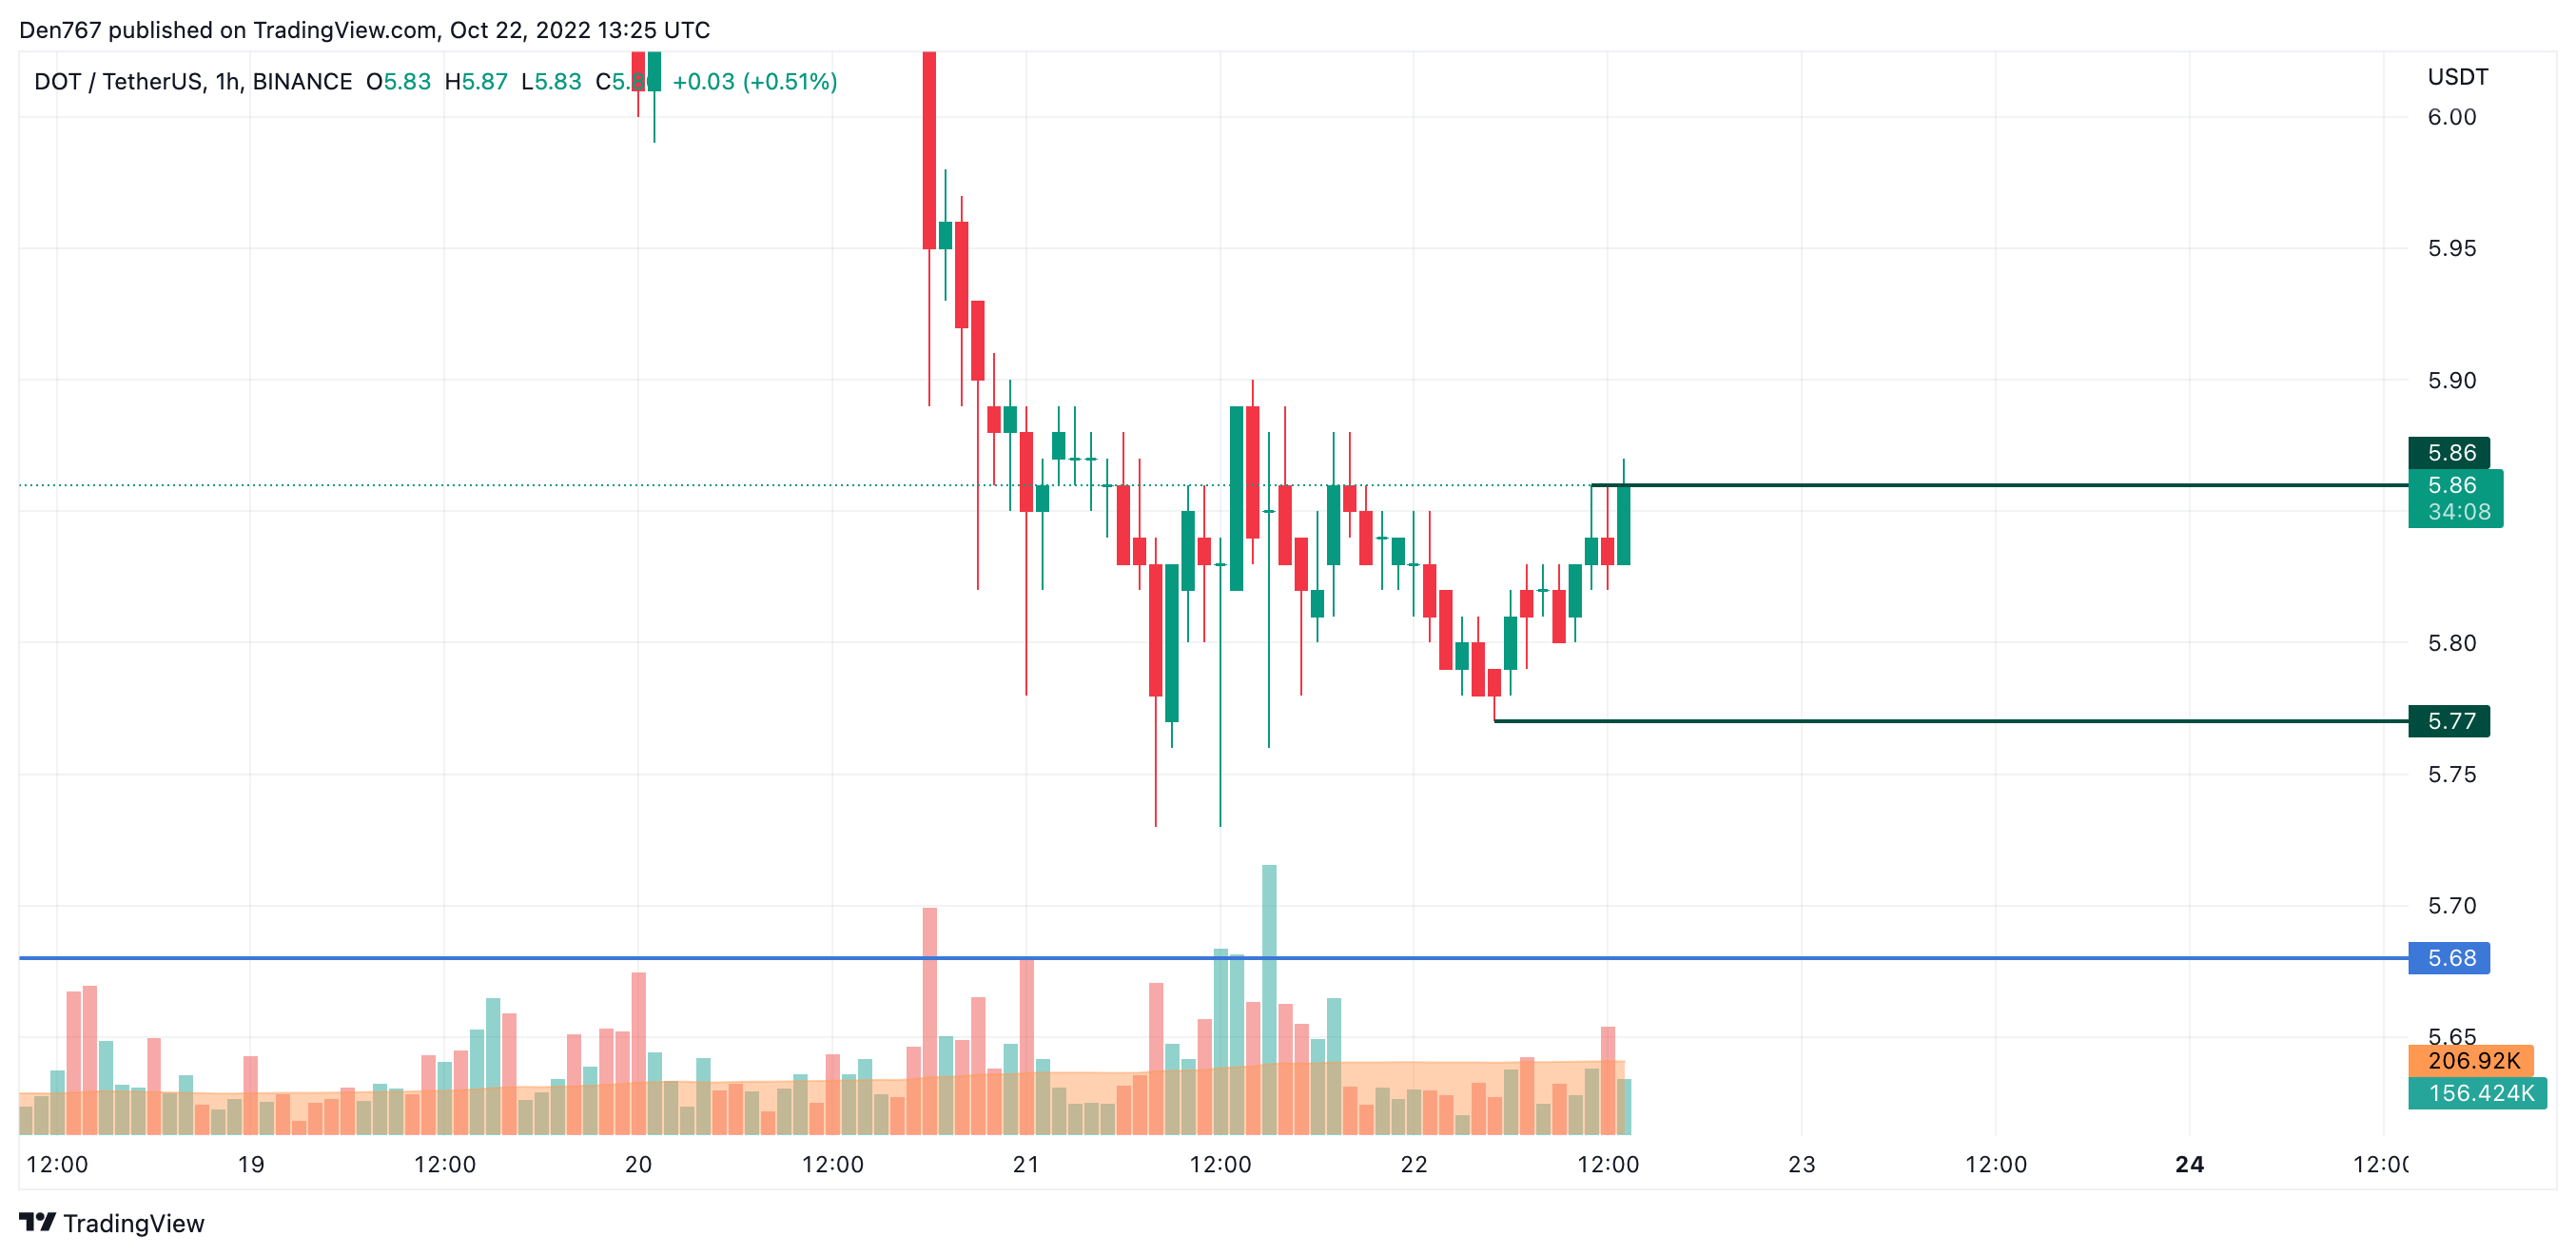
On the local time frame, Polkadot (DOT) has formed a resistance level at $5.86. If growth continues, there is a possibility to see a test of the $5.90 mark.

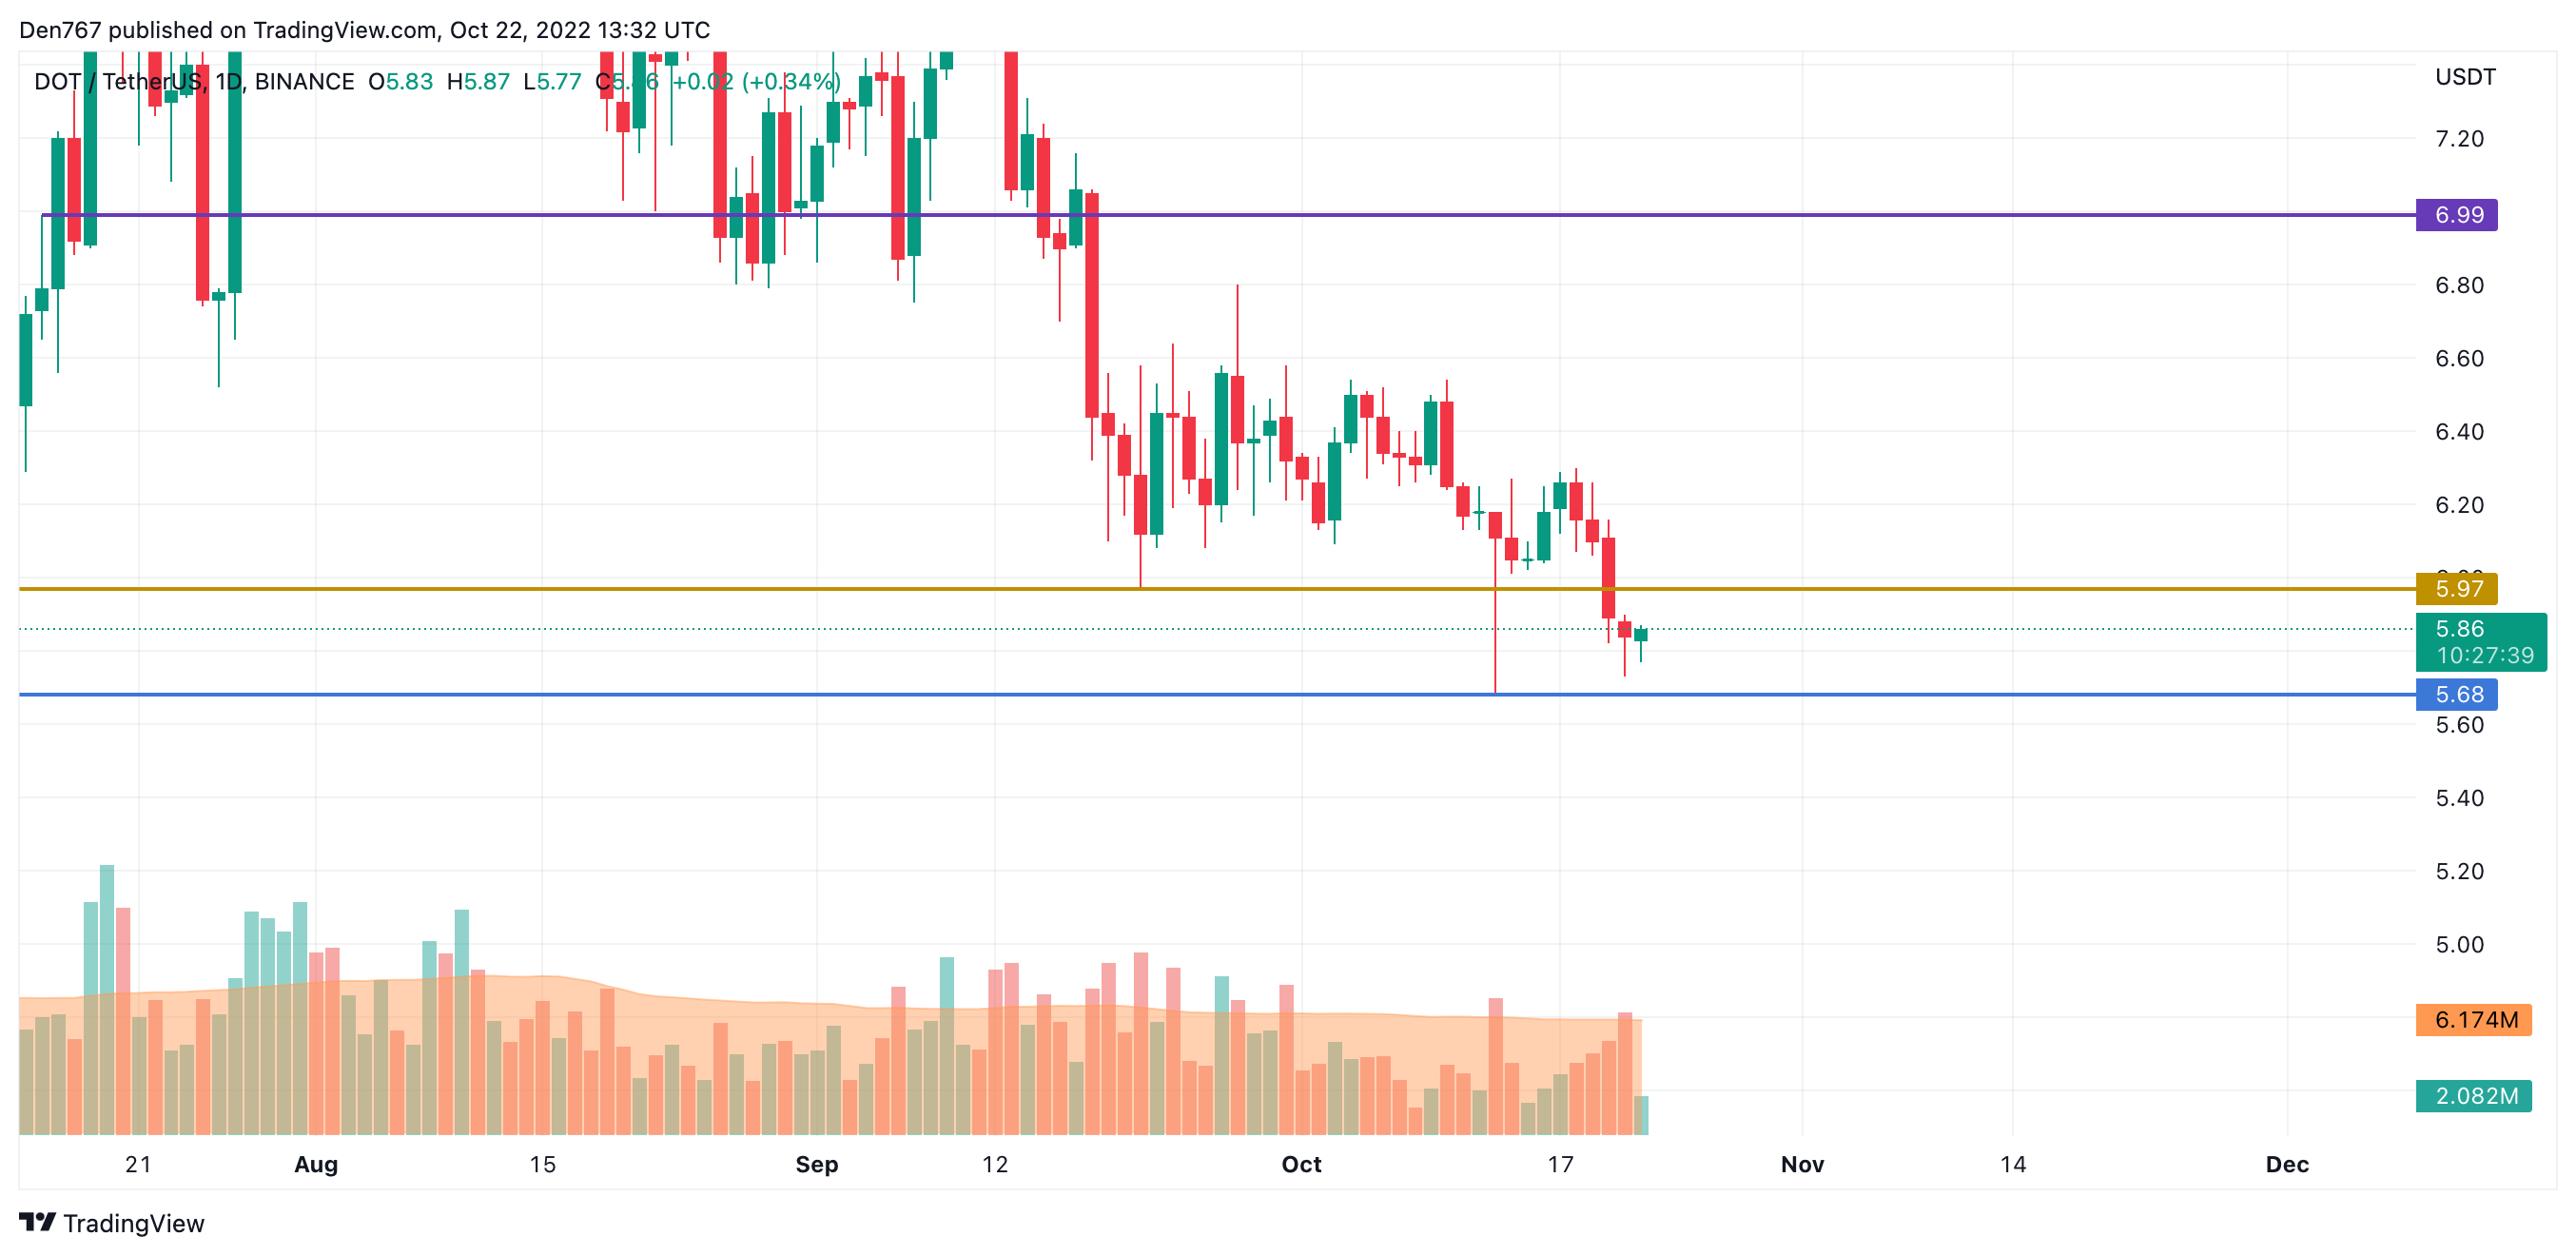
On the daily chart, DOT has not accumulated enough power for a rise, which is confirmed by the low volume.
However, buyers might seize the initiative in the following weeks if the rate can be fixed above the vital $6 zone.

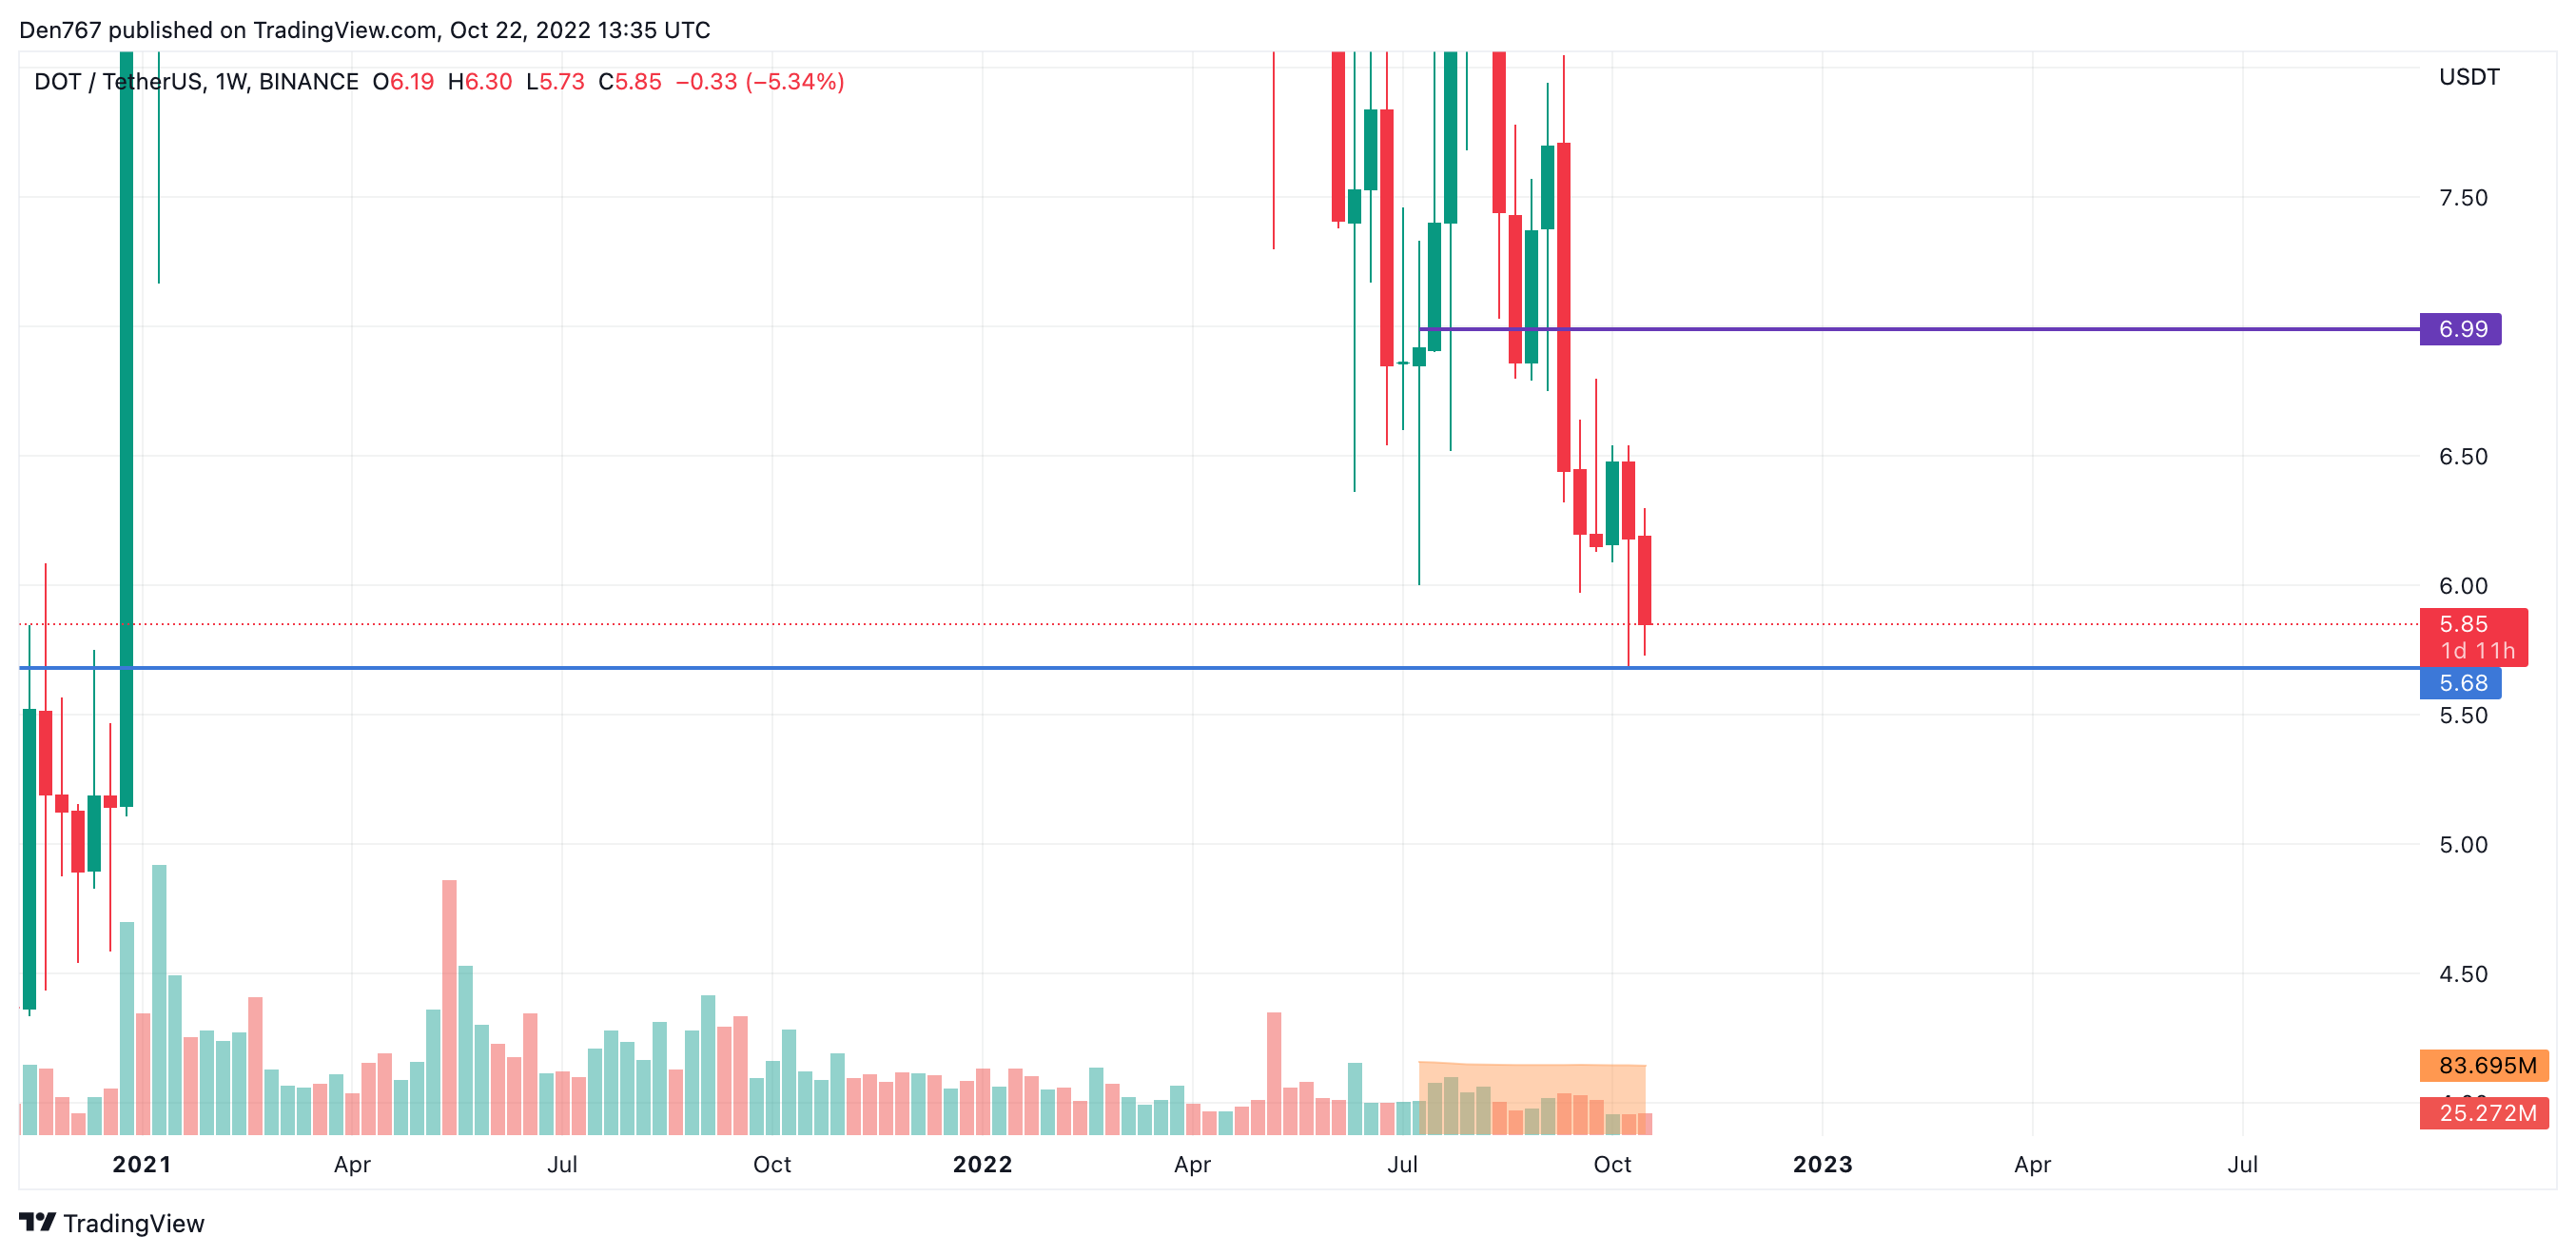
From the midterm point of view, the situation is different, as bears’ influence remains relevant. If the fall continues below the $5.68 mark, traders can expect a sharp drop to the $5 zone shortly.
DOT is trading at $5.85 at press time.


