Is MANA Price Posed for Collapse?
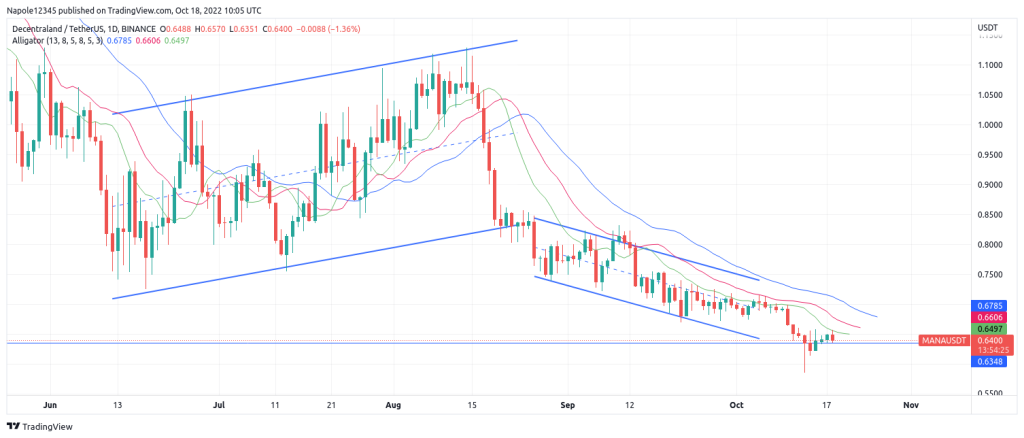
More than 10 days since reports indicated that the Decentraland platform only had 38 daily active users for 24 hours, the MANA price has continued to struggle in the markets. It has traded in a sideways market for the past week, along the $0.63 support level.
The data from DappRadar, which showed that Decentraland had 38 active users for a period of 24 hours, was quickly rubbished by the platform, which questioned their definition of ‘active users’ in their research. According to Decentraland, DappRadar counted only the unique addresses that interacted with the platform’s smart contract. However, Decentraland counts its active users as unique blockchain addresses interacting with their systems. Therefore, Decentraland estimated their average daily visitors to be around 8,000.
However, even with the explanation, many people were still critical of the platform’s explanation and low number. They pointed out that the platform’s $1.2 billion valuation was too big for a platform with 8,000 daily active users. The platform’s September numbers that indicated that 1074 users had interacted with its smart contract was also a point of concern for many, especially considering the money and valuation of the company.
Decentraland Price Prediction
Fortunately, even with the revelations that the platform had low number of active users interacting with their smart contract, Decentlands price performance in the markets has remained stable. Since the revelations, it has mostly traded in a sideways market. With today’s trading session going down by a percentage point, it is a sign that the sideways market is likely to continue.
Therefore, I expect Decentraland price to continue trading along the $0.63 support level fo the next few trading sessions. There is a high likelihood that the current sideways market may extend for more than a week. However, if a new trend is established, I expect it to be bearish with Decentraland prices falling below October’s price low of $0.58.
Decentraland Daily Chart
