Ethereum (ETH) Price Analysis for September 19
Bulls could not seize the initiative for a long time as all of the top 10 coins have come back to the red zone.

ETH/USD
The rate of Ethereum (ETH) has declined by 4.50% over the last 24 hours.

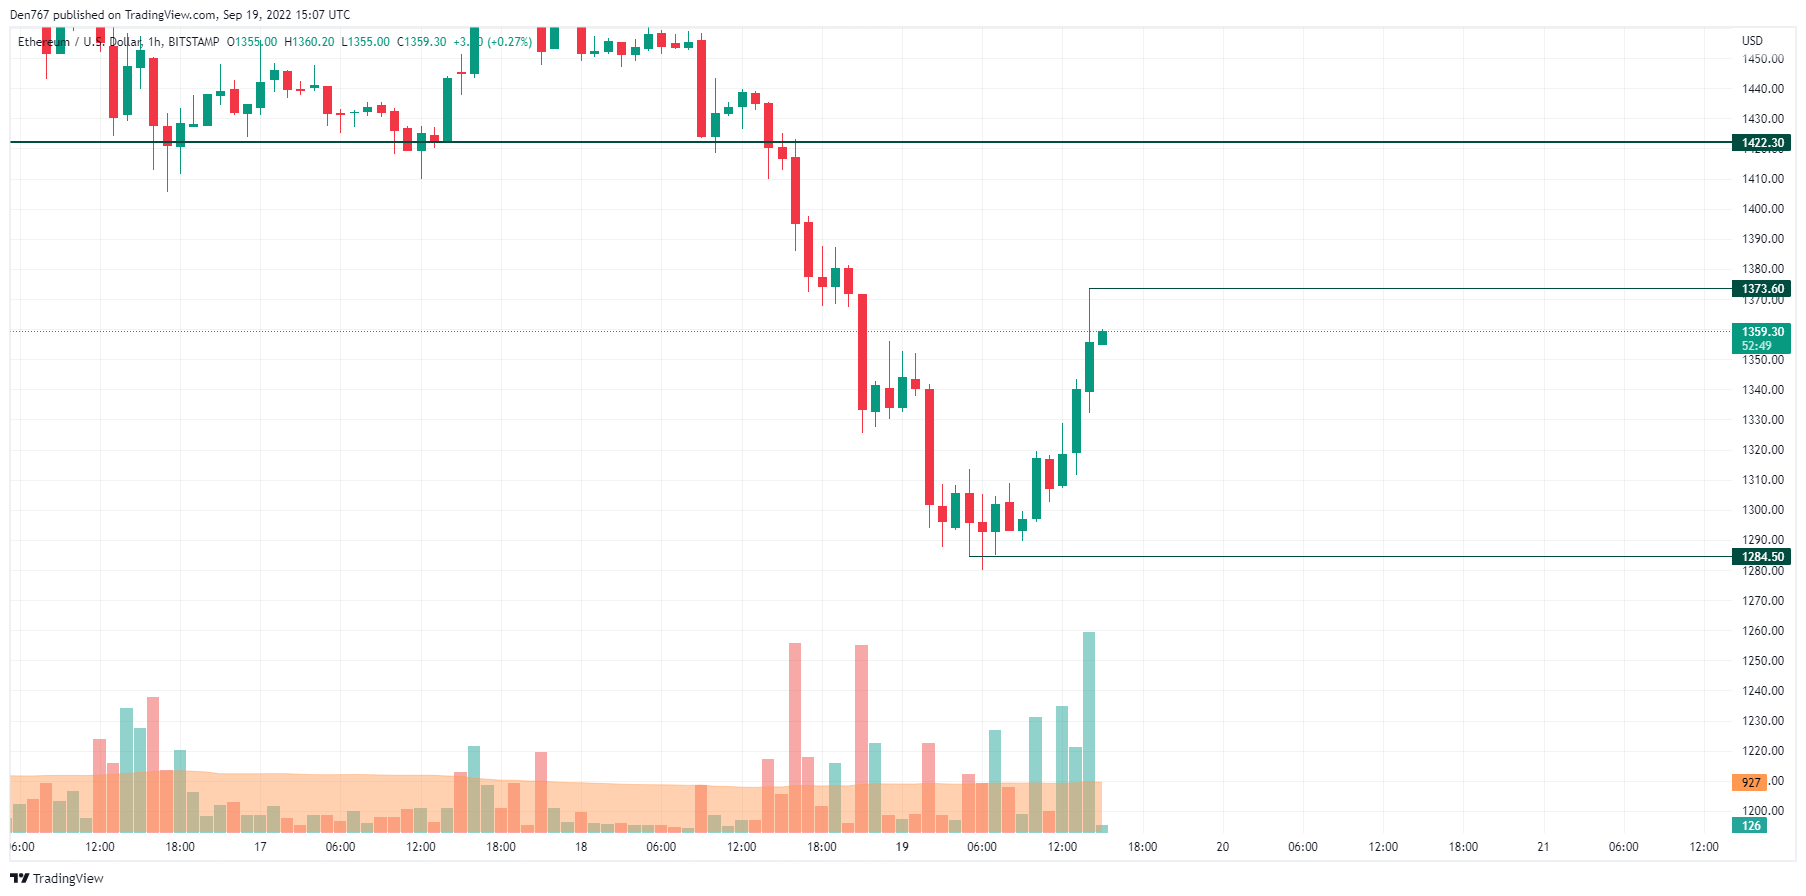
However, on the hourly chart, the situation is different. The price has made a false breakout of the local support level at $1,284, showing buyers’ pressure. If buyers can keep the rate above the $1,300 mark, there are chances for further growth.

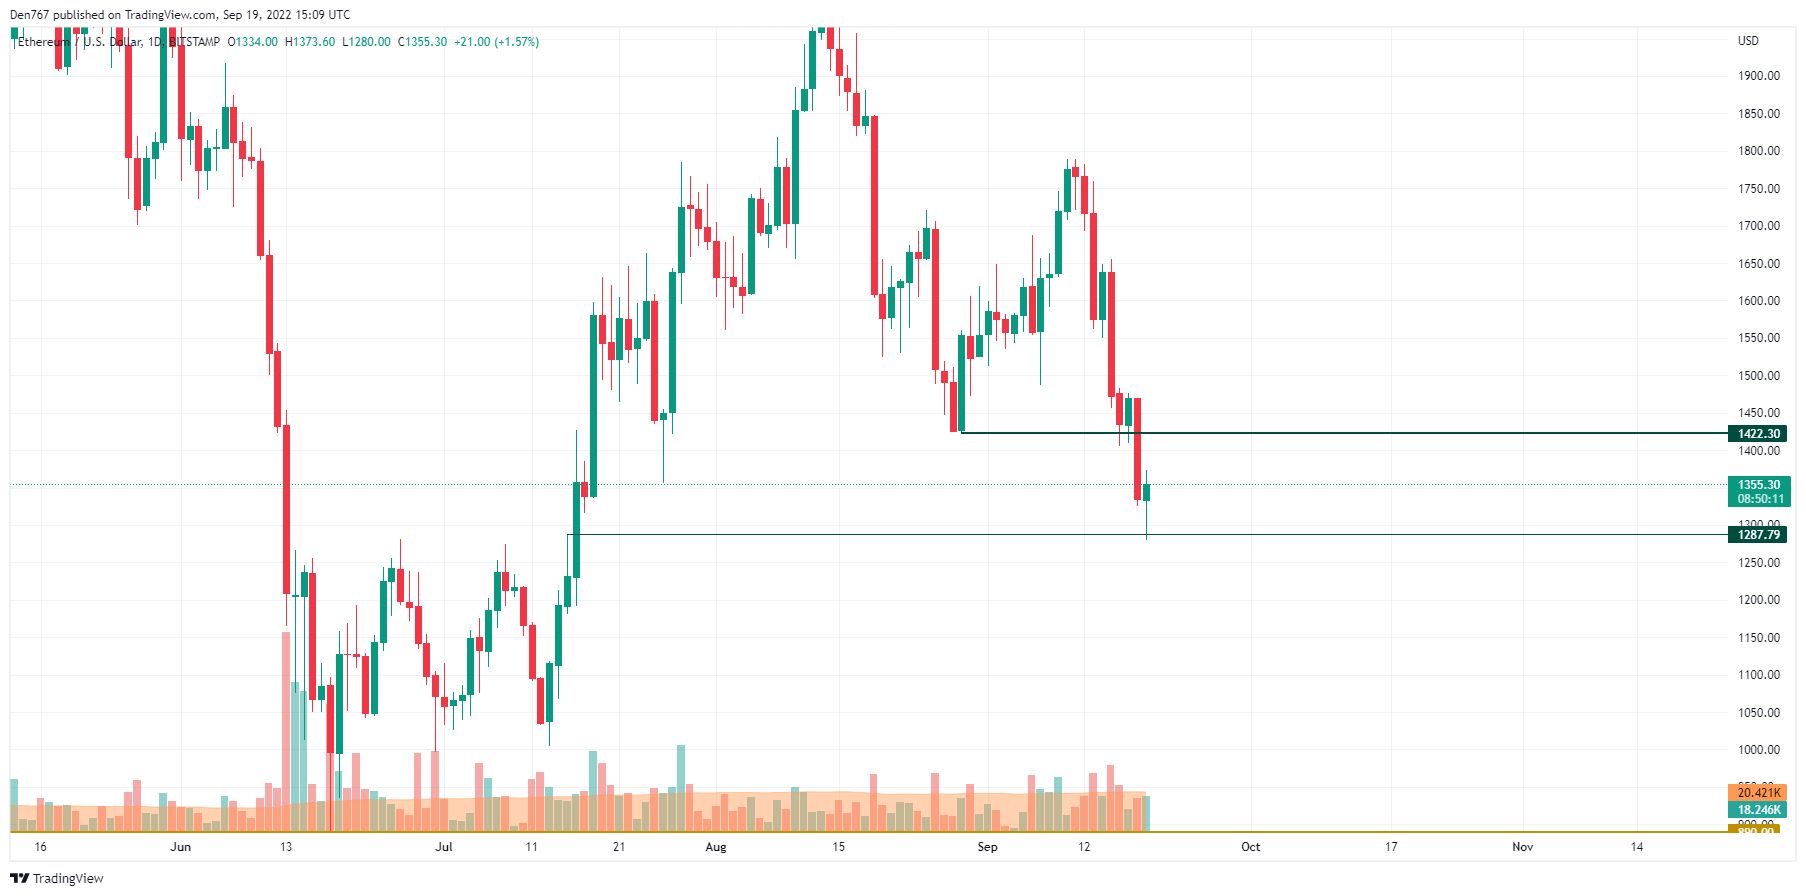
On the daily time frame, the price has bounced off the mirror level at $1,287 against the increased volume. However, it is too early to think about a fast recovery as Ethereum (ETH) needs more time to accumulate power for a midterm rise. In this case, sideways trading in the range of $1,300-$1,400 remains the more likely scenario.

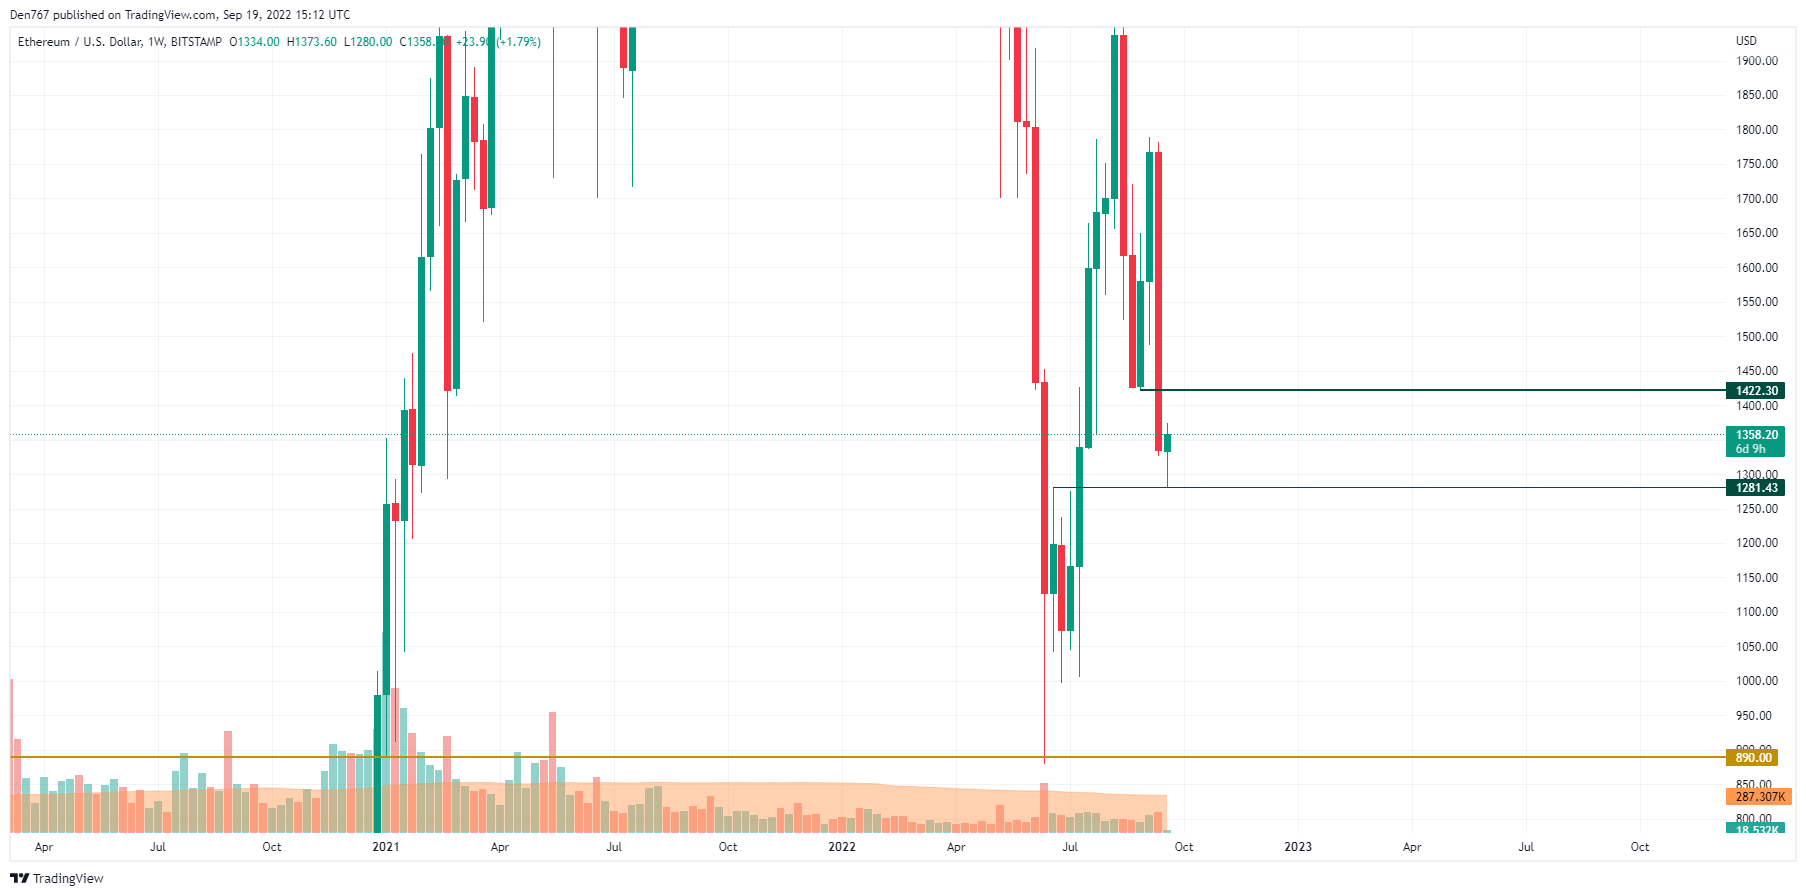
On the bigger chart, there is also a false breakout of the mentioned level; however, the week has just started and everything can change by Saturday. However, if a slow rise to the $1,400 zone starts, bulls have the chance to seize the initiative.
Ethereum is trading at $1,355 at press time.


