How to Read Crypto Charts?
Reading a crypto chart is quintessential for both newbies and experienced traders of the crypto world. Crypto charts are used to help crypto traders make better investment and trading decisions when dealing with cryptos. They are similar to other technical charts that help traders pick equity. But for the uninitiated, crypto charts are graphical representations of the price, volume, and time intervals with respect to the crypto market. But do you know how to read a crypto chart like a pro? Let’s get started with the basics, then.
Dow Theory: The Foundation of Technical Analysis
Before we start with how to read a crypto chart, it is inevitable for every trader to know the Dow theory. Charles Dow pioneered technical analysis. He co-founded Dow Jones & Company. He was also the founder and editor of the Wall Street Journal. Dow’s ideas were developed in a series of Wall Street Journal editorials. Following his death, other editors, such as William Hamilton, refined these ideas and assembled what is now known as the Dow theory from his editorials. The Dow theory can be called a framework for technical analysis. It enumerates 6 fundamental tenets. Dow’s tenets can be considered the preamble for traders trying to identify and follow a crypto trend.
1. The market reflects everything
The Dow theory is based on the hypothesis of efficient markets (EMH). It claims that asset prices reflect all available information and trade on crypto or stock exchanges at their fair value. In other words, this strategy is the polar opposite of behavioral economics. For example, if an organisation’s earnings are widely expected to improve, the market will reflect the potential improvements even before it occurs. Demand for the company shares will increase prior to the release of the improvement report. Also, the price may not change significantly after the expected positive report is released.
2. There are three market trends
This theory was the first to propose that the market moves in three directions:
- Primary Trend: Primary trends can last months to years and be uptrends or downtrends. This is the most significant market movement. Primary trends can be either a bull market, in which asset prices rise over time or a bear market, in which asset prices fall over time.
- Secondary Trend: Secondary trends are considered corrections to a primary trend. These trends may work in opposition to the primary trend. Secondary trends can be pullbacks in bull markets. In these cases, the asset prices temporarily fall. Secondary trends can also be rallies in bear markets. In such cases, prices temporarily rise before continuing to fall. These trends can last from a few weeks to a few months.
- Tertiary Trend: Tertiary trends usually die in less than a week or less than ten days. They are frequently dismissed as market noise that can be ignored. Tertiary trends can be defined as daily fluctuations in market movement. Some analysts believe that tertiary trends reflect market chatter.
Investors can find opportunities by examining these various trends. For example, by reading a crypto chart, you may find a crypto that has a positive primary trend but a negative secondary trend. In this scenario, you may be able to buy the crypto at a low price and sell it once its value has increased.
3. Trends have three phases
According to the Dow theory, there are 3 phases to each primary trend:
- Accumulation Phase: The accumulation phase is the start of a primary upward (or downward) trend in a bull (or bear) market. During this stage, smart traders recognize the beginning of a new trend and either accumulate ahead of an upward movement or distribute ahead of a downward movement.
- Phase of Public Participation: In this phase, the broader market recognizes the opportunity that smart traders have already identified. Due to this, the public becomes more active in purchasing. This causes market prices to either rise or fall.
- Panic Phase: The panic phase is distinguished by excessive buying by investors. Market participants begin to distribute their holdings. This means that they sell their holdings to other participants who have yet to recognize that the trend is about to reverse.
4. Indices must confirm each other
Dow believed that primary market trends seen on one index should be confirmed by trends seen on another. According to the theory, traders should not assume a new primary upward trend is beginning if one index confirms a new primary upward trend while another remains in a primary downward trend. For example, if India experiences a bullish trend, all indices like the Nifty, Sensex, Nifty Midcap, Nifty Smallcap, and others should rise, confirming the trend seen in each other. Similarly, for a bearish trend, all indices should be moving downward.
5. Trends are confirmed by volume
If the price is moving in the direction of the primary trend, the volume should increase. On the other hand, if it is moving against it, the volume should decrease. The greater the volume, the more likely the movement reflects the true market trend. When trading volume is low, price action may not accurately reflect the market trend. In an upward trend, for example, volume rises with a price increase and falls with a price decrease. In a downward trend, volume increases with price fall and decreases with price rise.
6. Trends will persist until definitive signals indicate otherwise
Dow believed that if the market were trending, it would remain trending. For example, if a crypto begins to rise in response to good news, it will continue to rise until a clear reversal occurs. Primary trend reversals can be confused with secondary trend reversals. As a result, Dow suggested that trend reversals be treated with suspicion and caution.
How to Read Crypto Charts?
In most crypto price charts, the main price indicator is a candlestick. Candlestick charts are easy to read. They provide a straightforward representation of price action. In practice, crypto market charts can be configured to display different timeframes. Here candlesticks represent each timeframe. For example, suppose a crypto trading chart is set to a four-hour timeframe. In that chart, each candlestick represents four hours of trading activity. The trading period chosen is determined by the trader’s style and strategy.


A candlestick is made up of two main bars:
- The thicker part is called the ‘Body.’ It shows the asset’s opening and closing prices.
- The thinner part is called the ‘wick.’ It shows the highest and lowest price points.
On most crypto charts, a green candle indicates a bullish move or an increase in price. Meanwhile, a red candle indicates a bearish move or a decrease in price. A candlestick with almost no body and long wicks, on the other hand, indicates that neither buyers nor sellers are in control. The size, shape, duration, and color of these candlesticks, as well as the patterns they produce, can provide hints about future price action. They allow analysts, buyers, and traders to take positions or make changes based on probability.
Basic Indicators and Patterns to Read a Crypto Chart
Indicators
There are many technical indicators to help traders read a crypto chart. Let’s discuss two popular technical indicators:
Moving Averages
The moving average (MA) line is calculated by averaging daily prices over a given time period. This line moves across the price chart. When trading in real-time crypto charts, moving averages can be adjusted to provide useful signals. Short-term price fluctuations are typically not considered by MA.
Support and Resistance Level
The levels of support and resistance are critical in interpreting crypto charts. During a pullback, support levels are price points at which cryptos, or any other asset are expected to halt due to a concentration of buying interest at that level. On the other hand, price levels at which there is concentrated selling interest are referred to as resistance levels. Traders frequently buy at support levels and sell at resistance levels.
Patterns
Traders can deduce potential price movements from patterns formed on cryptocurrency charts, in addition to technical indicators. Let’s have a look at 3 popular crypto patterns:
Hammer Candle Pattern

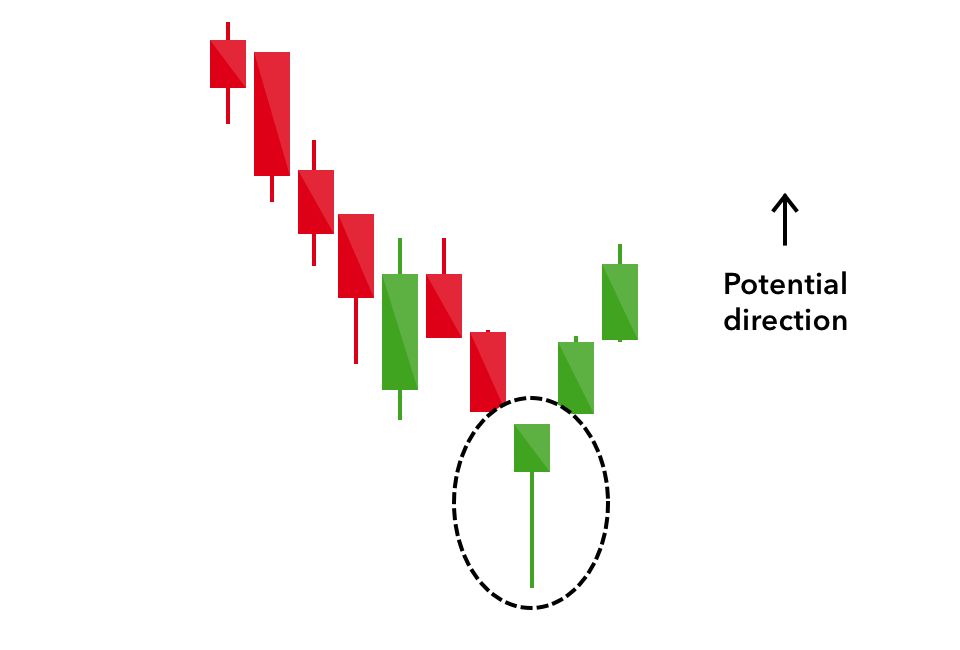
‘Bullish hammer’ is a type of reversal pattern. They typically form following a price decline at the bottom of a downtrend. It also indicates that buyers are flooding into the market. The long bottom wick represents the hammer’s handle. And the entire candle body represents the hammer’s head.
Head and Shoulders

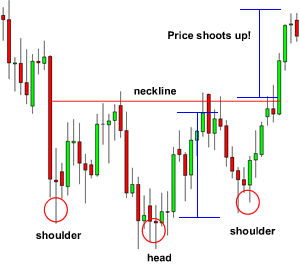
Head and shoulders patterns are trend reversal patterns. They can appear at the top or bottom of a trend. A bullish ‘head and shoulders’ pattern may indicate that the crypto price is about to rise. In the meantime, a bearish ‘head and shoulders’ pattern may precede a price decline. These patterns show a clear tug-of-war between buyers and sellers.
Wedges


Wedges demonstrate a trend that is losing traction in action. In a crypto chart, you can draw ‘wedges’ by connecting the lower points of price movement over time and another line that traces the price peaks. When those two lines intersect from left to right, you have a wedge. A bullish wedge may indicate that the asset is about to take a positive turn. Meanwhile, a bearish wedge may precede a cryptocurrency price peak and subsequent sell-off.
Conclusion
Crypto price charts can help you forecast price trends and trade more easily. Chart reading should be used to get a better understanding of the crypto market by learning more techniques and supported by a strong hold on crypto market fundamentals. However, chart reading is not the sole criterion of crypto trading. A thorough examination of crypto charts and patterns, combined with an analytical mindset and sufficient practice, may eventually provide traders with a competitive advantage.
Also Read | A beginner’s guide to blockchain technology


