Bitcoin, Ethereum Sell-off Deepens as Fundamentals Drive Crypto Lower
Bitcoin Outlook: Bearish
- BTC/USD tumbles after Jackson Hole’s hawkish tilt
- Ethereum hard hit by risk aversion as cryptocurrency market cap dips below $1 Trillion
- USD firms with this ISM manufacturing and US NFP (non-farm payrolls) on tap
Bitcoin, Ethereum Bludgeoned by Powell
The Jackson Hole Economic Symposium was the highlight of the week as market participants awaited Fed Chair Jerome Powell’s speech. With the annual event hosted by the Federal Reserve Bank of Kansas City, this year’s topic was centered around ‘Reassessing Constraints on the Economy and Policy’ and the prominent threat of inflation.
Visit DailyFX Education to learn about the role of central banks in global markets
Preceding Powell’s commentary, a softer Core PCE (the Fed’s preferred measure of inflation) print initially allowed Bitcoin to move higher before plunging through prior support turned resistance at $21,500. As hopes of a 50-basis point rate hike at the September FOMC dwindled, the major cryptocurrency erased gains providing a platform for bearish continuation.
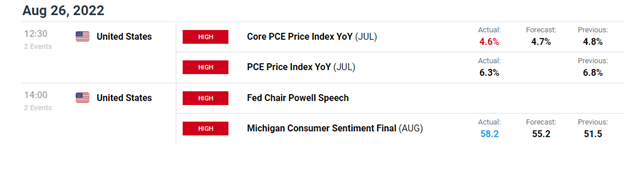
DailyFX Economic Calendar
Bitcoin 5 Minute Chart
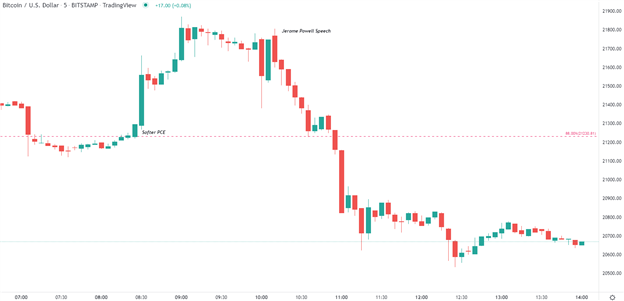
Chart prepared by Tammy Da Costa using TradingView
With monetary policy focused on driving inflation back towards the Fed’s target of 2% without disrupting the labor market, it could be another big week for crypto.
While markets continue to price in expectations, the US Dollar and Bitcoin may continue to whipsaw in anticipation of August ISM data and the NFP (Non-Farm Payroll) report. With rate expectations favoring another 75-point rate hike next month, higher yields will likely continue to jeopardize the bullish move.
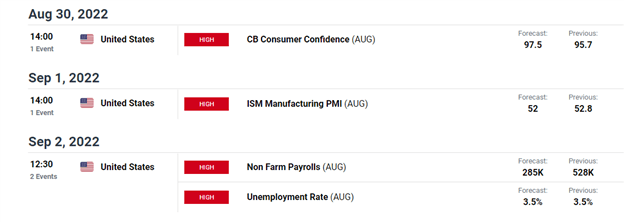
DailyFX Economic Calendar
As the total market capitalization of the crypto industry dips back below $1 Trillion, both fundamental and technical levels may result in an increase in volatility and an increase in momentum.
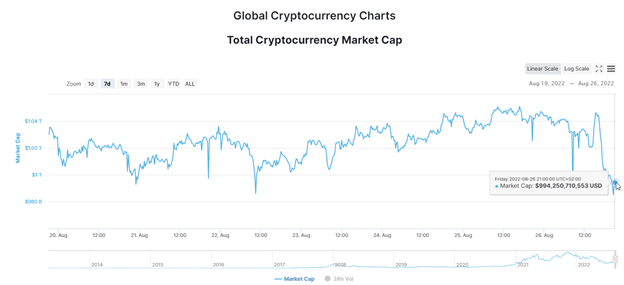
Source: CoinmarketCap.com
In terms of technical analysis, a hold below $21,000 and below the lower bound of the bearish flag at around $20,300 could drive price action back towards the July low $18,905 with the June low then coming into play at $17,592.
Bitcoin (BTC/USD) Daily Chart
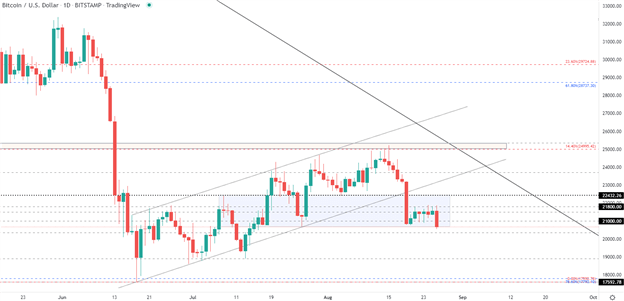
Chart prepared by Tammy Da Costa using TradingView
— Written by Tammy Da Costa, Analyst for DailyFX.com
Contact and follow Tammy on Twitter: @Tams707


