ETH Facing Huge Resistance, Is Major Correction Inbound Before $2K? (Ethereum Price Analysis)
After several attempts, the bulls finally pushed the price above the 100-day moving average line. However, Ethereum is still struggling to break above the major resistance area between the $1,700 – $1,800 range.
Technical Analysis
Technical Analysis By Grizzly
The Daily Chart
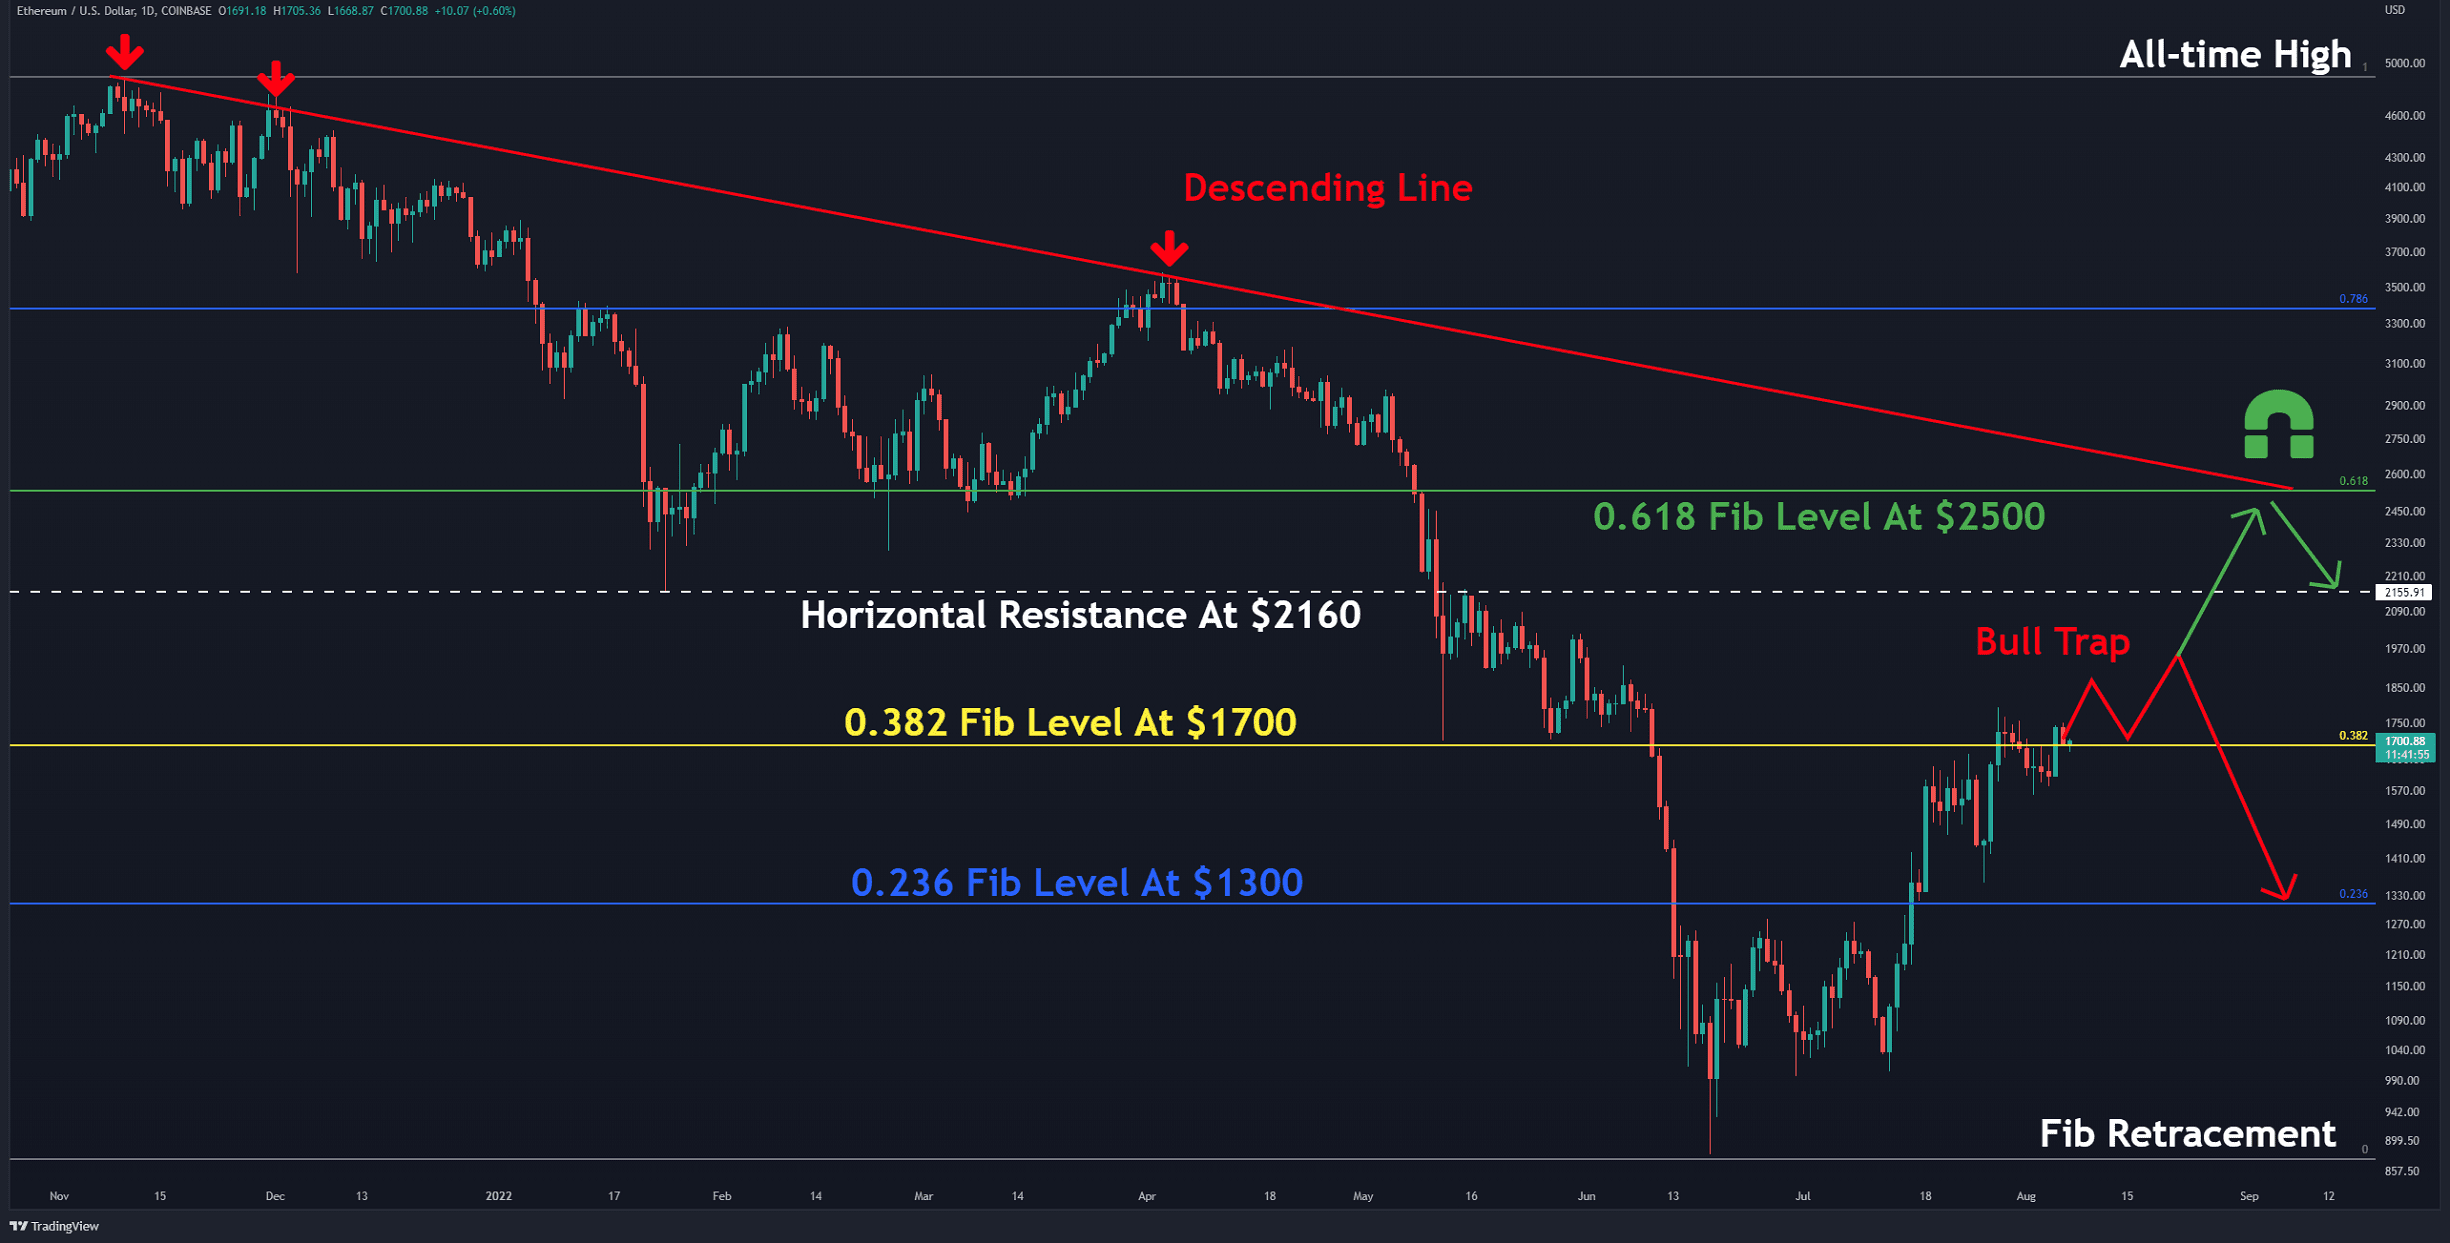
Support and resistance levels have appeared on the chart in the daily timeframe using the Fibonacci retracement tool, extending from the all-time high to the last realized bottom at $880 recorded in June.
As can be seen, the bulls quickly broke above the first resistance, which was at the 0.236 Fib level (in blue) around $1300. Yet, it seems that the 0.382 Fib level (in yellow) has become a direct obstacle for the bulls. Historically, this level has played an important role: In the rally of 2021, the ETH price got stuck below it for three weeks.
Looking over the next short-term, there are two possible scenarios:
First and foremost, ETH breaks and closes above the $1800 mark and targets the next significant levels around $1,900-$2,000. There, it will turn into a bull-trap – long liquidations and back down for a retest of the critical level at $1,300.
In the second scenario, ETH breaks $1800 and cracks above the horizontal resistance at $2160 (in white), and moves towards the red-marked descending line, which overlaps with the 0.618 Fib level (in green). There, it’s expected that ETH will get a rejection on its first attempt. In this scenario, since the 200-day moving average is reclaimed, we can definitely state that the bulls had regained market control.
Key Support Levels: $1500 & $1350
Key Resistance Levels: $1800 & $2160
Daily Moving Averages:
MA20: $1614
MA50: $1349
MA100: $1656
MA200: $2280
The ETH/BTC Chart
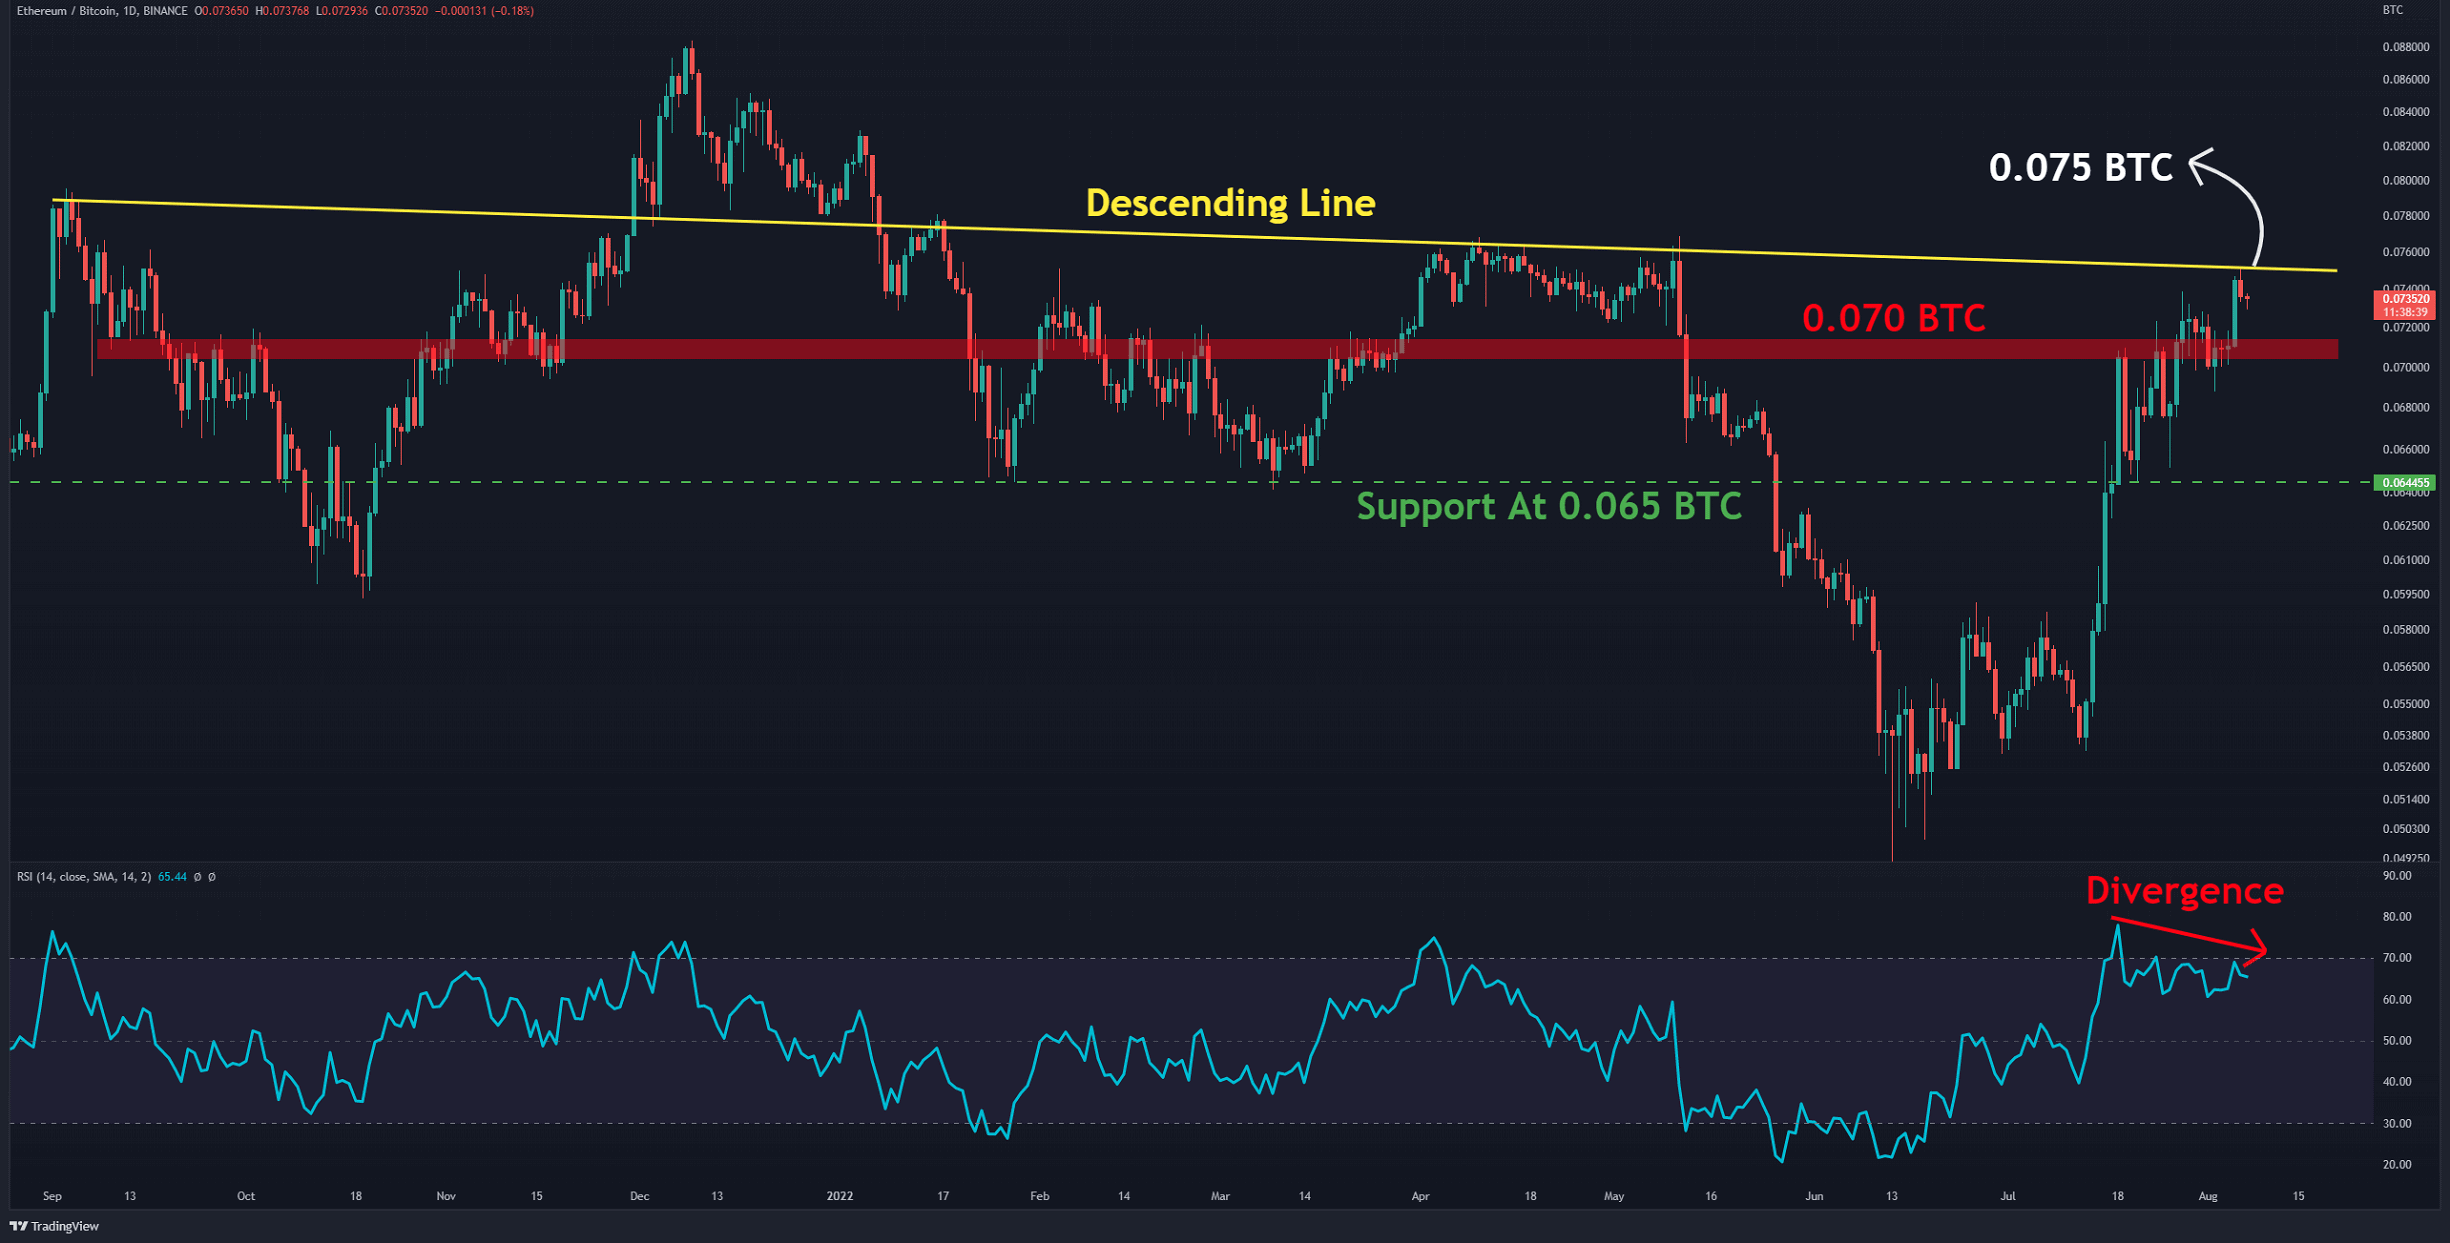
Against Bitcoin, as expected, the bulls were able to pull the price towards the descending line resistance (in yellow).
Since the bearish divergence (in red) has been witnessed by the RSI indicator, it is expected that the bulls will rest around this area.
From below, it should be noted that the bulls must defend the horizontal level at 0.07 BTC, while there’s potential that the bears can dominate the market by forming a lower low. If the 0.07 BTC level breaks down, ETH is expected to extend towards the next support at 0.065 BTC (in green).
Key Support Levels: 0.07 & 0.065 BTC
Key Resistance Levels: 0.075 & 0.08 BTC
On-chain Analysis
Exchange Netflow: Definition: The difference between coins flowing in and out of the exchange. Inflow – Outflow = Netflow.
A positive value indicates that the reserve is increasing.
The price has reached a solid resistance from a technical point of view, so investors are currently looking at Ethereum with more skepticism and caution. Furthermore, this has resulted in the metric not changing much. If this resistance gets broken, Ethereum will be withdrawn from the exchange, and the histogram bars will turn red.

Binance Free $100 (Exclusive): Use this link to register and receive $100 free and 10% off fees on Binance Futures first month (terms).
PrimeXBT Special Offer: Use this link to register & enter POTATO50 code to receive up to $7,000 on your deposits.
Disclaimer: Information found on CryptoPotato is those of writers quoted. It does not represent the opinions of CryptoPotato on whether to buy, sell, or hold any investments. You are advised to conduct your own research before making any investment decisions. Use provided information at your own risk. See Disclaimer for more information.
Cryptocurrency charts by TradingView.