Keep Your Eyes On These 4 Altcoins Next Week: Here are the Prospects!
There is bullishness in the last week of the month, when the crypto market is aiming to end its 3-month losing streak. The four altcoins are poised for another breakout, according to crypto analyst Bob Mason. We have prepared Bob Mason’s analysis of selected altcoin projects for our readers.
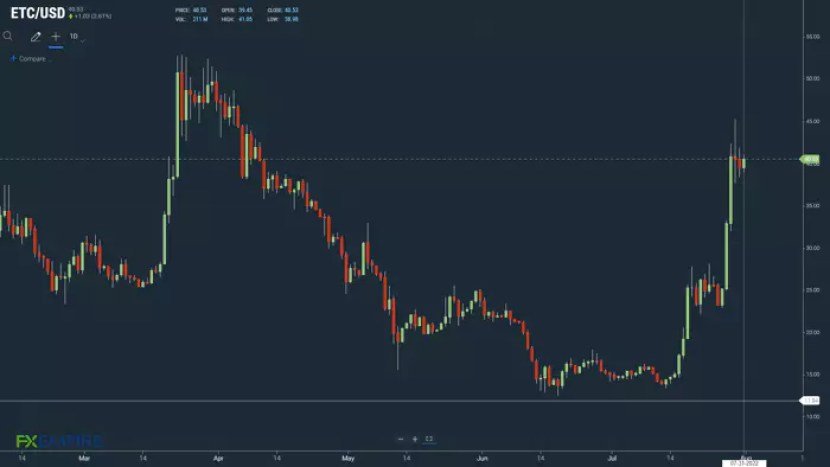
The first altcoin Ethereum Classic (ETC)
This week, from Monday to Sunday morning, Ethereum Classic (ETC) is up 58.63% to $40.53. Following the broader market, ETC dropped to Tuesday’s low of $22.89 before surging to Friday’s high of $45.27. It found support from the wider market. Also, Ethereum’s move towards Merge continued to increase demand for ETC.
Looking at the trends, a move to the July high of $45.27 is likely to support a run to the April high of $48.63 and $50. Avoiding a drop below $30 will be the key for ETC to continue its short-term uptrend.
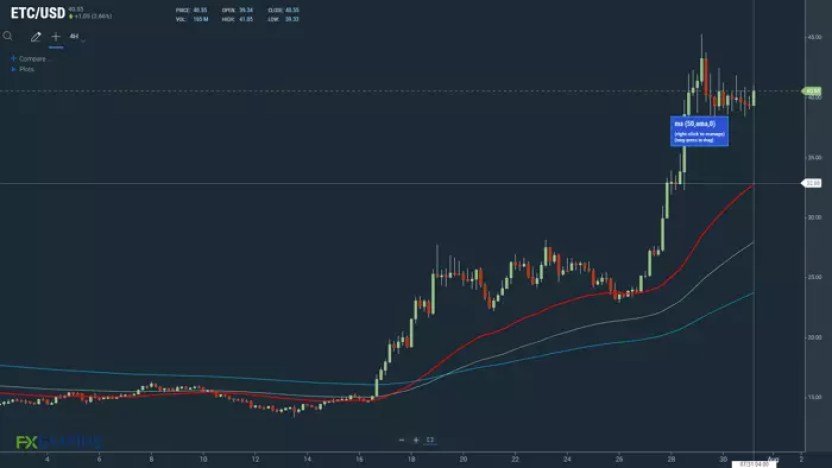
Looking at the EMAs and the 4-hour candlestick chart (below), this was a bullish signal. This morning, ETC settled above the 50-day EMA, currently at $32.88. The 50-day EMA has withdrawn from the 100-day EMA. Then the 100-day EMA broke out from the 200-day EMA. Both are giving bullish ETC signals.
Further expansion of the 50-day EMA from the 100-day EMA will support the bullish next week. However, ETC will need to stay above the 50-day EMA to avoid a return to below $30 and the 100-day EMA currently at $28.00.
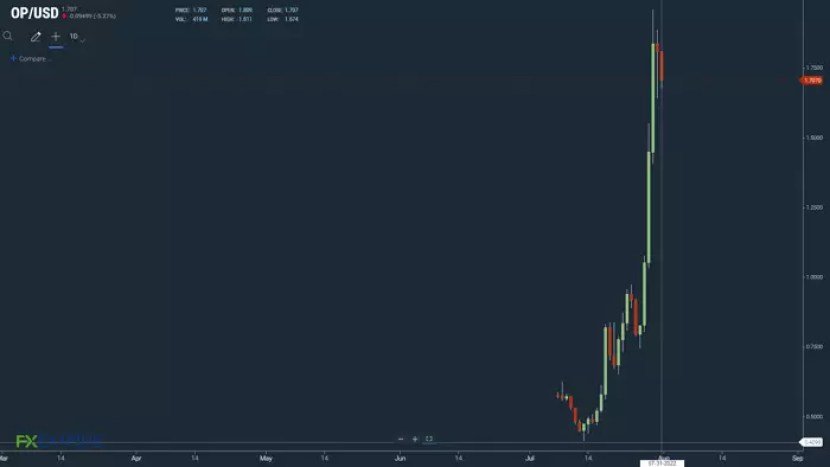
Second on the analyst’s list is Optimism (OP)
This week, Monday through Sunday morning Optimism (OP) is up 85.70% to $1,7070. It started the week with a bearish start. The OP dropped to Tuesday’s low of $0.7458 before climbing Friday’s high to $1.9620.
The OP found support from the broader crypto market. In addition, news updates from the network also provided a boost. As you follow on Kriptokoin.com, Curve Finance news, which offers a management proposal on Optimism for 100 million OP tokens to be distributed in Curve Pool, provided early support. The platform has also released a new trading system, Drippie, which adds more support.
Looking at the trends, a break from the weekly high of $1,880 is likely to support a run at $2.00. However, the sentiment in the broader crypto market will need to recover for an exit at $1.90.
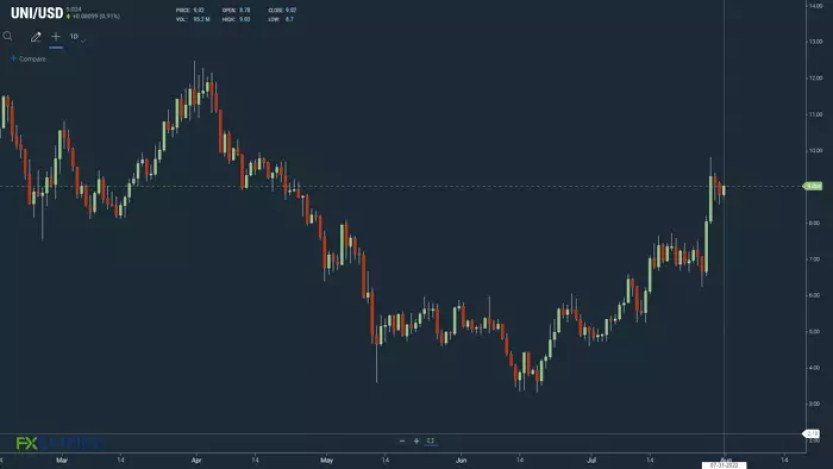
The third ranked altcoin is Uniswap (UNI).
This week, Uniswap (UNI) rose 24.41% to $9.02. The altcoin has moved in line with the broader market trend. UNI dropped to $6.22 from Tuesday’s low before hitting a new high of $9.82 to Thursday and July. However, UNI, which had a bearish trend towards the end of the week, fell below $9.00.
UNI also received support from the wider market. Also, news of a move towards a ‘Fees Pass’ provided a boost. Looking at the trends, a break from the July high of $9.82 is likely to set the April high of $12.30 into the spotlight. However, UNI will need to break the resistance at $10.00 to continue the uptrend. A drop to $6.22 from last week’s low would set sub-$5.00 on the agenda. It will then activate this year’s low of $3.33.
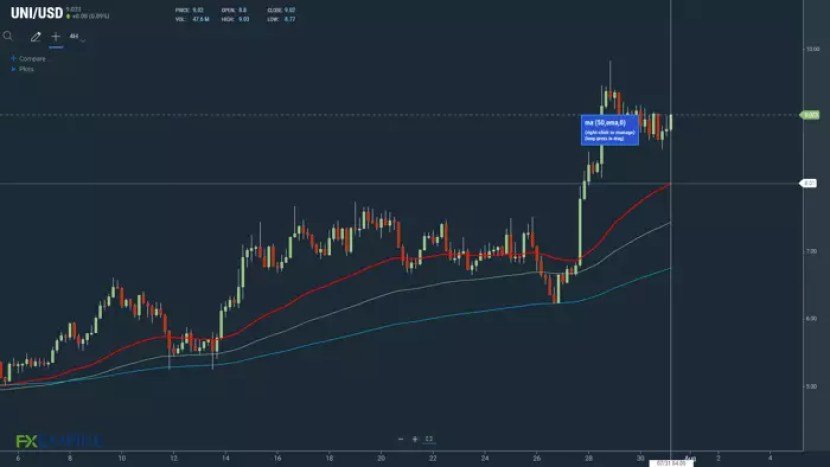
Looking at the EMAs and the 4-hour candlestick chart (below), this was a bullish signal. This morning UNI settled above the 50-day EMA, currently at $8.01. Pulled from the 50-day 100-day EMA. Also, the 100-day EMA has withdrawn from the 200-day EMA. Both are signaling rising UNI.
Expanding the 50-day EMA from the 100-day EMA would support a $10.00 run to target April’s high. However, UNI will need to stay above the 50-day EMA to avoid the 100-day EMA currently at $7.45 and last week’s low of $6.22.
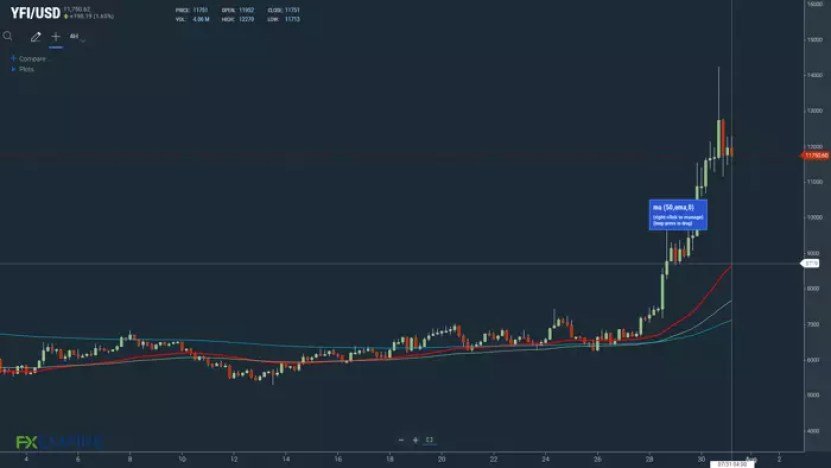
At the bottom of the list is Yearn.Finance (YFI)
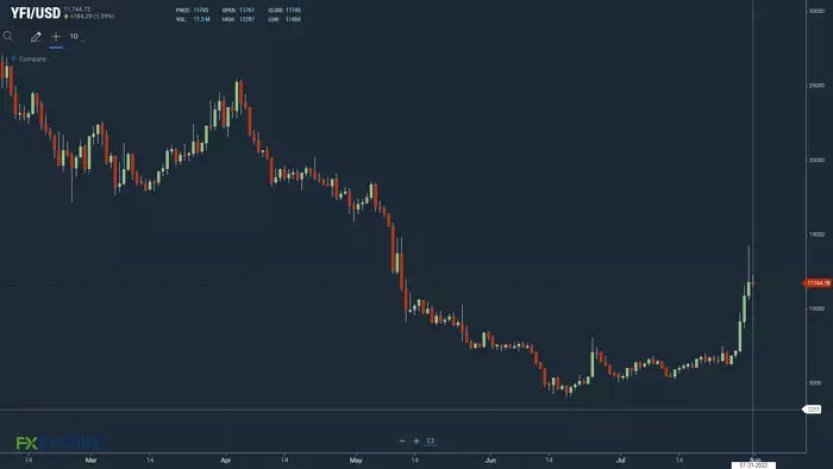
This week, Yearn.Finance (YFI) was up 68.31 percent to $11,745. The altcoin followed the broader market. YFI slid to a low of $6,250 on Tuesday before surging to a high of $14,239 on Saturday and July’s high. A late pullback on Saturday brought YFI back below $12,000 to limit the week’s upward move.
YFI has found support from the broader crypto market. Also, market sentiment for YFI’s anticipated August launch provided the breakout week. Looking at the trends, a breakout from Saturday’s high of $14,239 would give YFI a free exit from May’s high of $18,565. YFI will need to return to $20 to continue its bullish trend. However, a pullback below $7.5 will cause YFI to face heavy selling pressure.
Looking at the 4-hour chart and the EMAs, the signal was bullish. YFI continued to stay away from the 50-day EMA currently at $8,719. The 50-day EMA has moved away from the 100-day EMA. Also, the 100-day EMA has diverged from the 200-day EMA, both of which are positive indicators of YFI.
Further expansion of the 50-day EMA from the 100-day EMA would support a break from the weekly high of $14,239 to target May’s high of $18,565. However, a drop to the 50-day EMA will open the door below $8. It will also reveal the 100-day EMA, which is currently at $7,782.