ETH Recovers 30% in Four Days but is The Bottom In? (Ethereum Price Analysis)
Ethereum has recovered by more than 30% in the past four days. Relative calmness has returned to the market, but it can’t yet be viewed as a bottom signal. The sharp trends always go through short-term ranging stages where the market is adsorbing the resistance or support levels.
Technical Analysis
By Grizzly
The Daily Chart
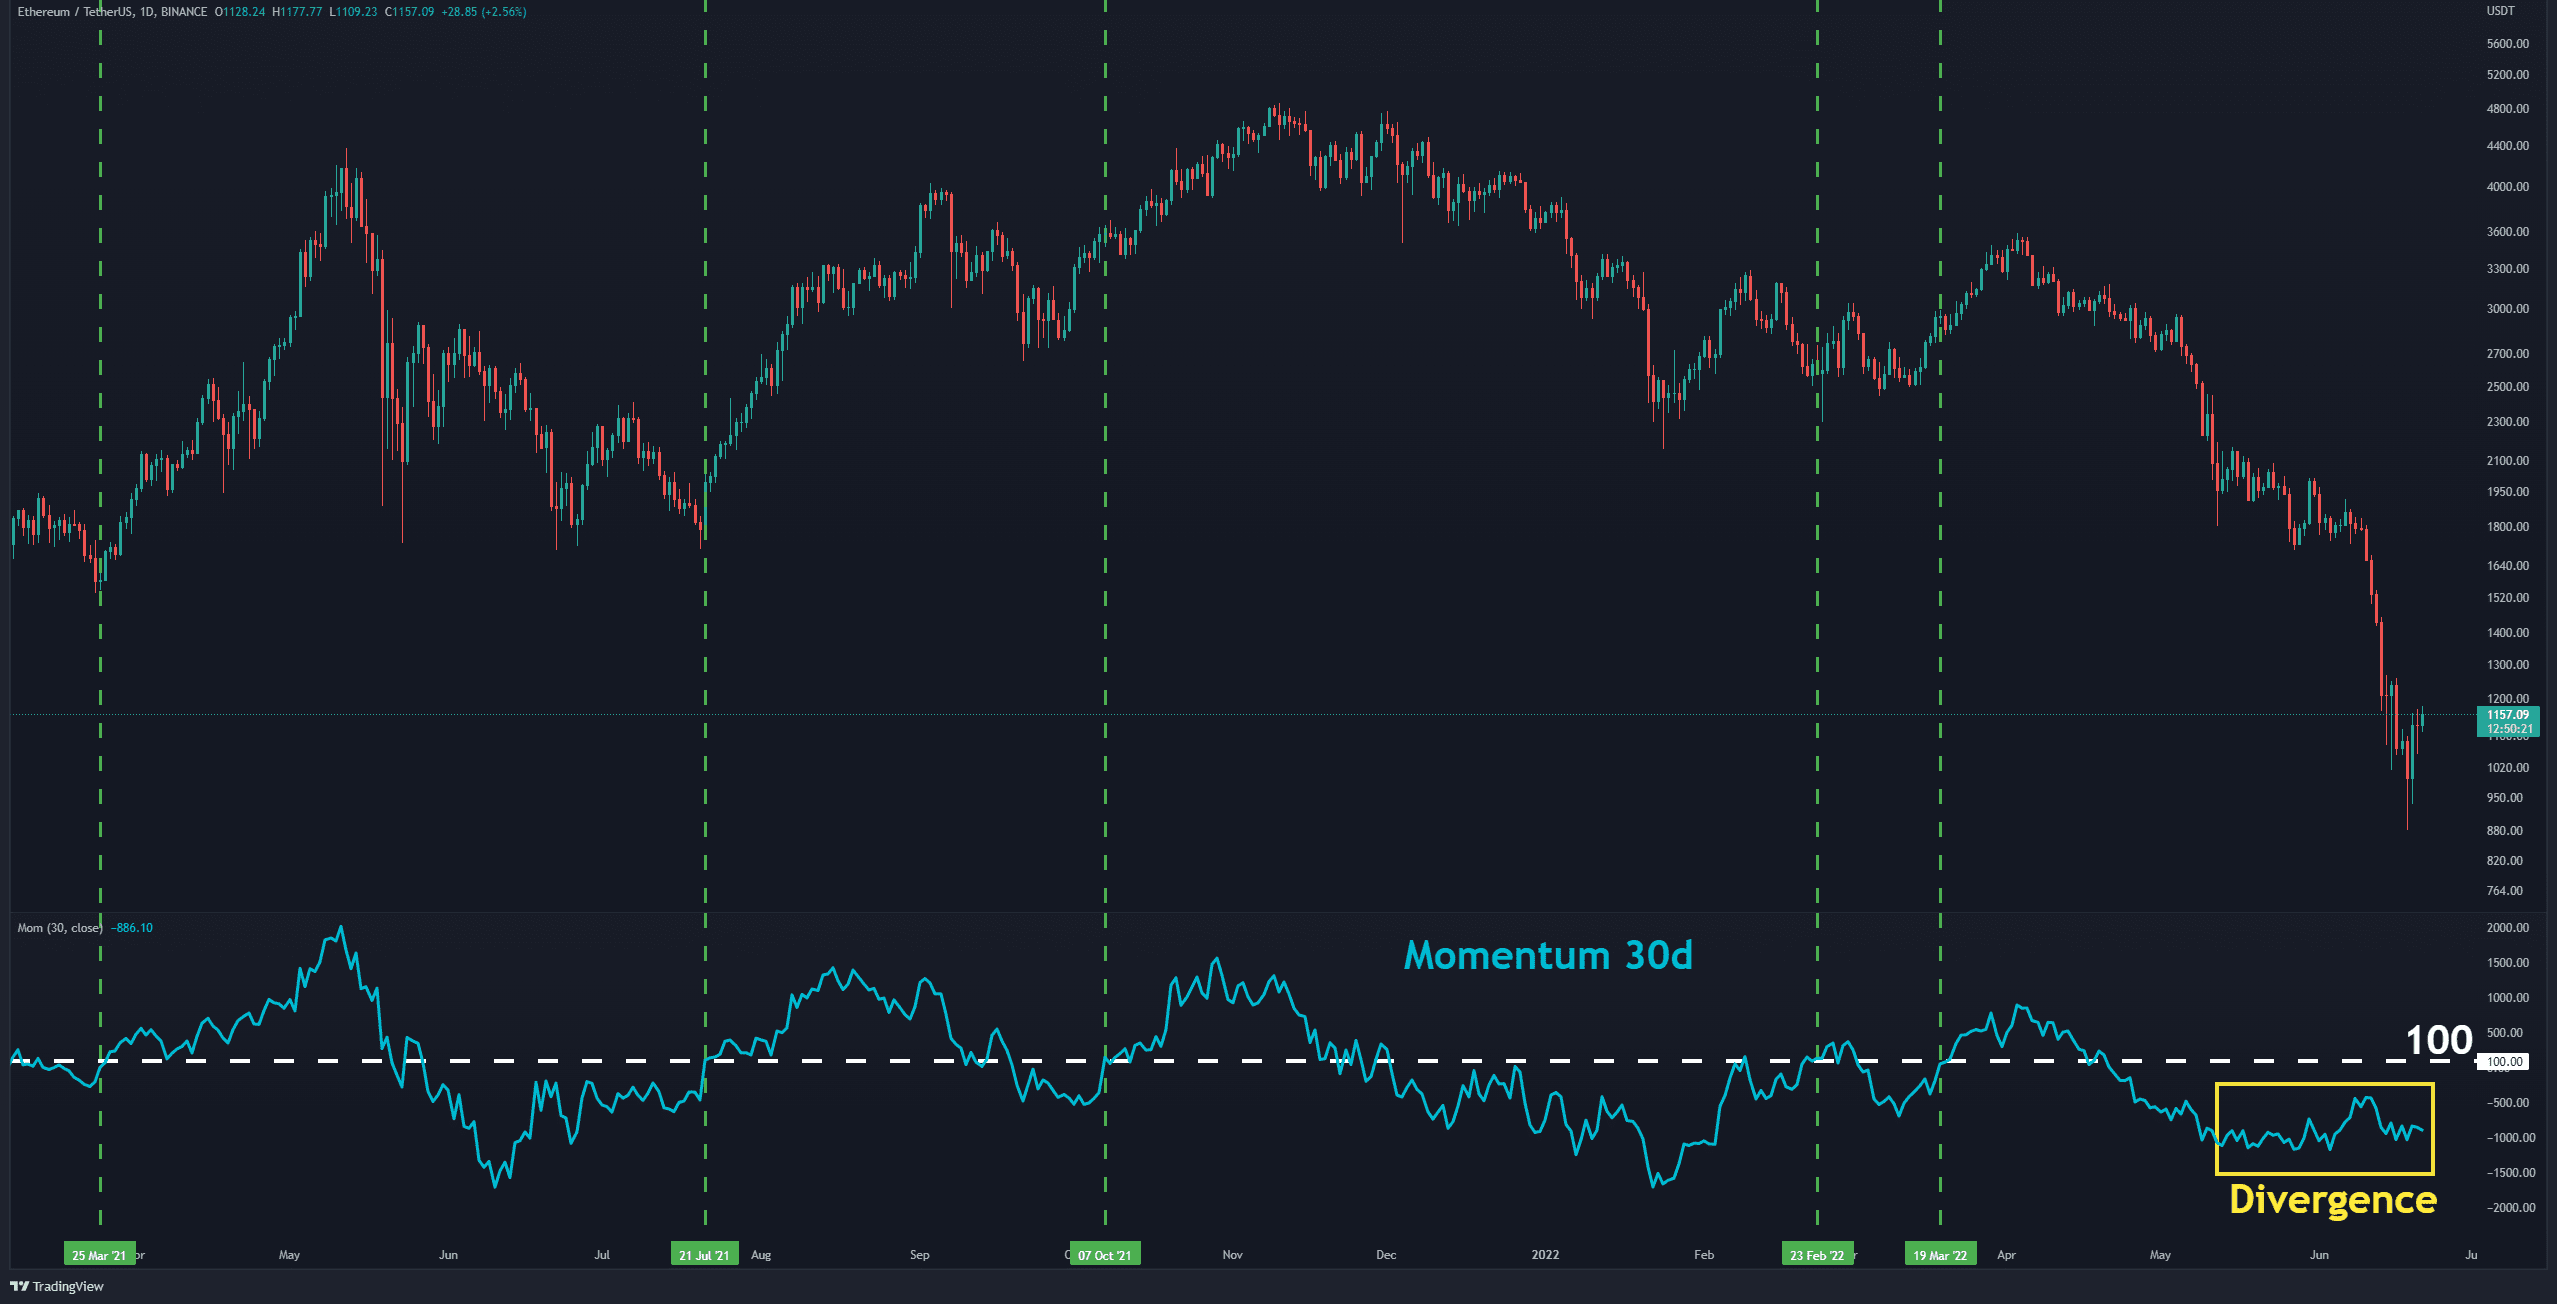
On the daily timeframe, after the bears managed to push the price below the psychological level of $1,000, buyers entered the market and pushed ETH back above it. They have been able to prevent the price from falling further. At this stage, it’s important to examine how strong the bullish momentum is.
By adding the 30D Momentum Indicator and looking at past examples, it can be seen that the uptrends have been characterized by the breaking of the white line (100) (green vertical line). Despite the positive divergence (in yellow) that is forming, this indicator has not broken the white line.
Therefore, it might be a bit too early to determine if the bulls are back in town. If that’s not the case, any bounce can be considered as a pullback to the broken support levels.
Key Support Levels: $880 & $700
Key Resistance Levels: $1300 & $1500 & $1700
Moving Averages:
MA20: $1465
MA50: $1865
MA100: $2462
MA200: $3049
The ETH/BTC Chart
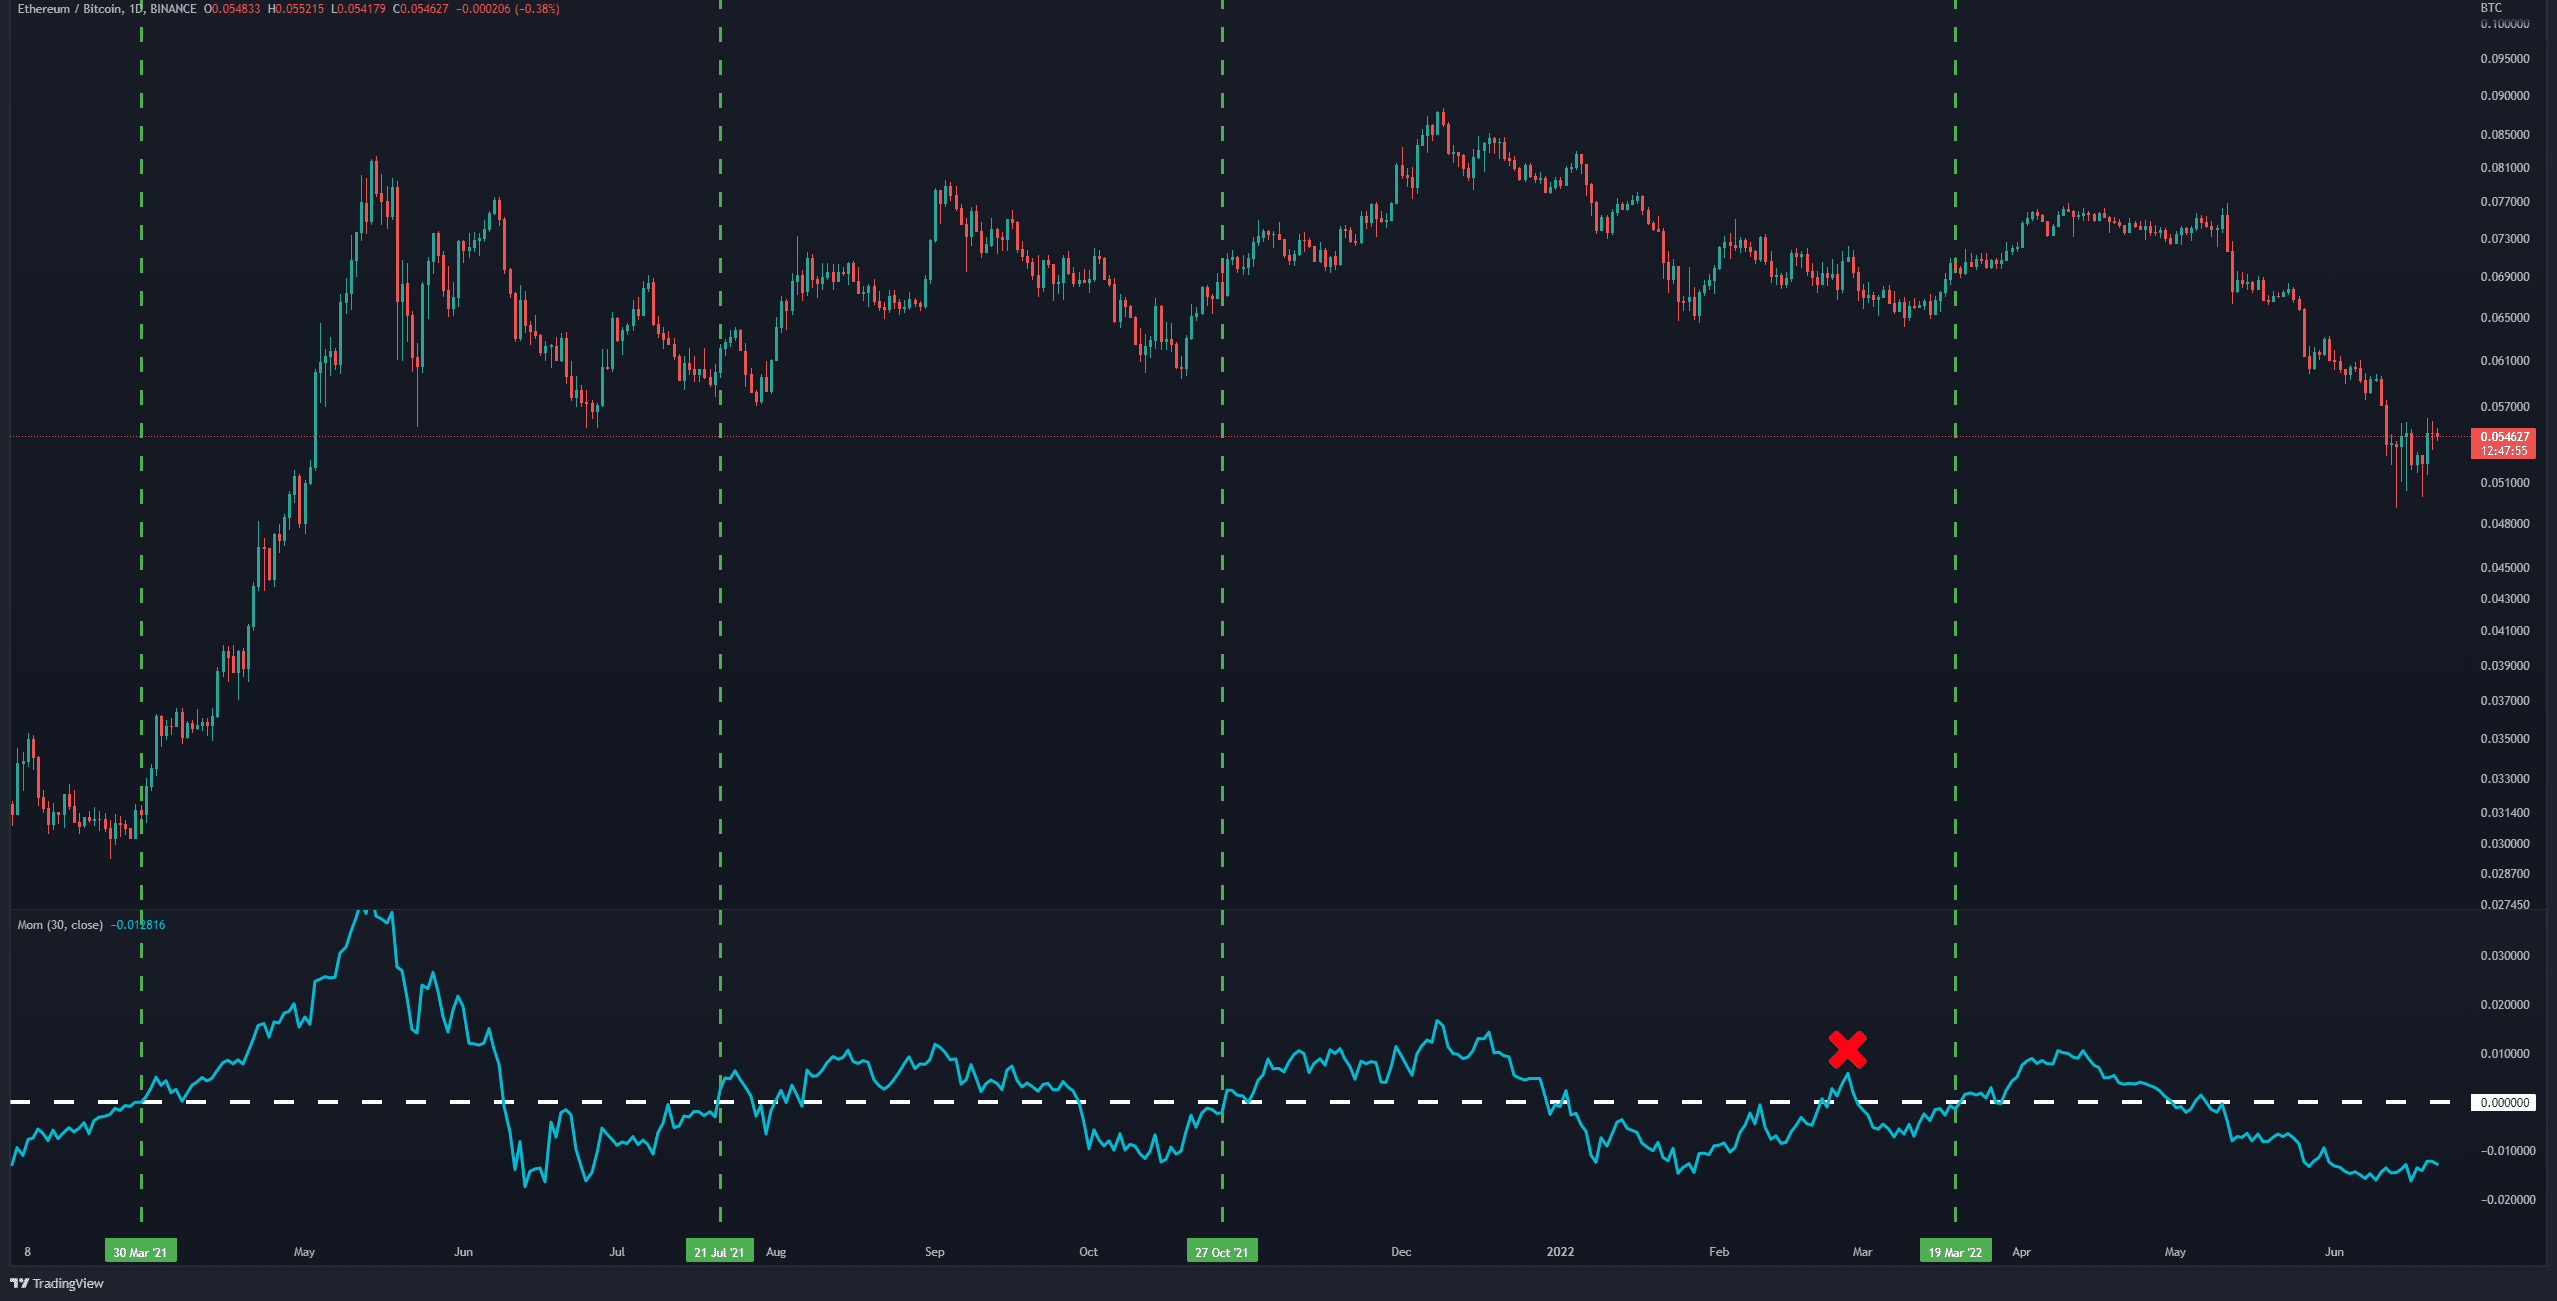
Once again, we observe the same indicator in ETH’s price action against Bitcoin. The interesting angle here is that all past uptrends, except for one, have all been associated with breaking the baseline (here, it is considered at zero). This chart currently shows a positive divergence which could be a sign of bottom formation.
It should be noted that the use of indicators alone can be misleading. Therefore, it’s always important to wait for the formation of a higher high and low after getting the first confirmation from this indicator.
Key Support Levels: 0.050 BTC & 0.0.045 BTC
Key Resistance Levels: 0.055 BTC & 0.06 BTC
On-chain Analysis
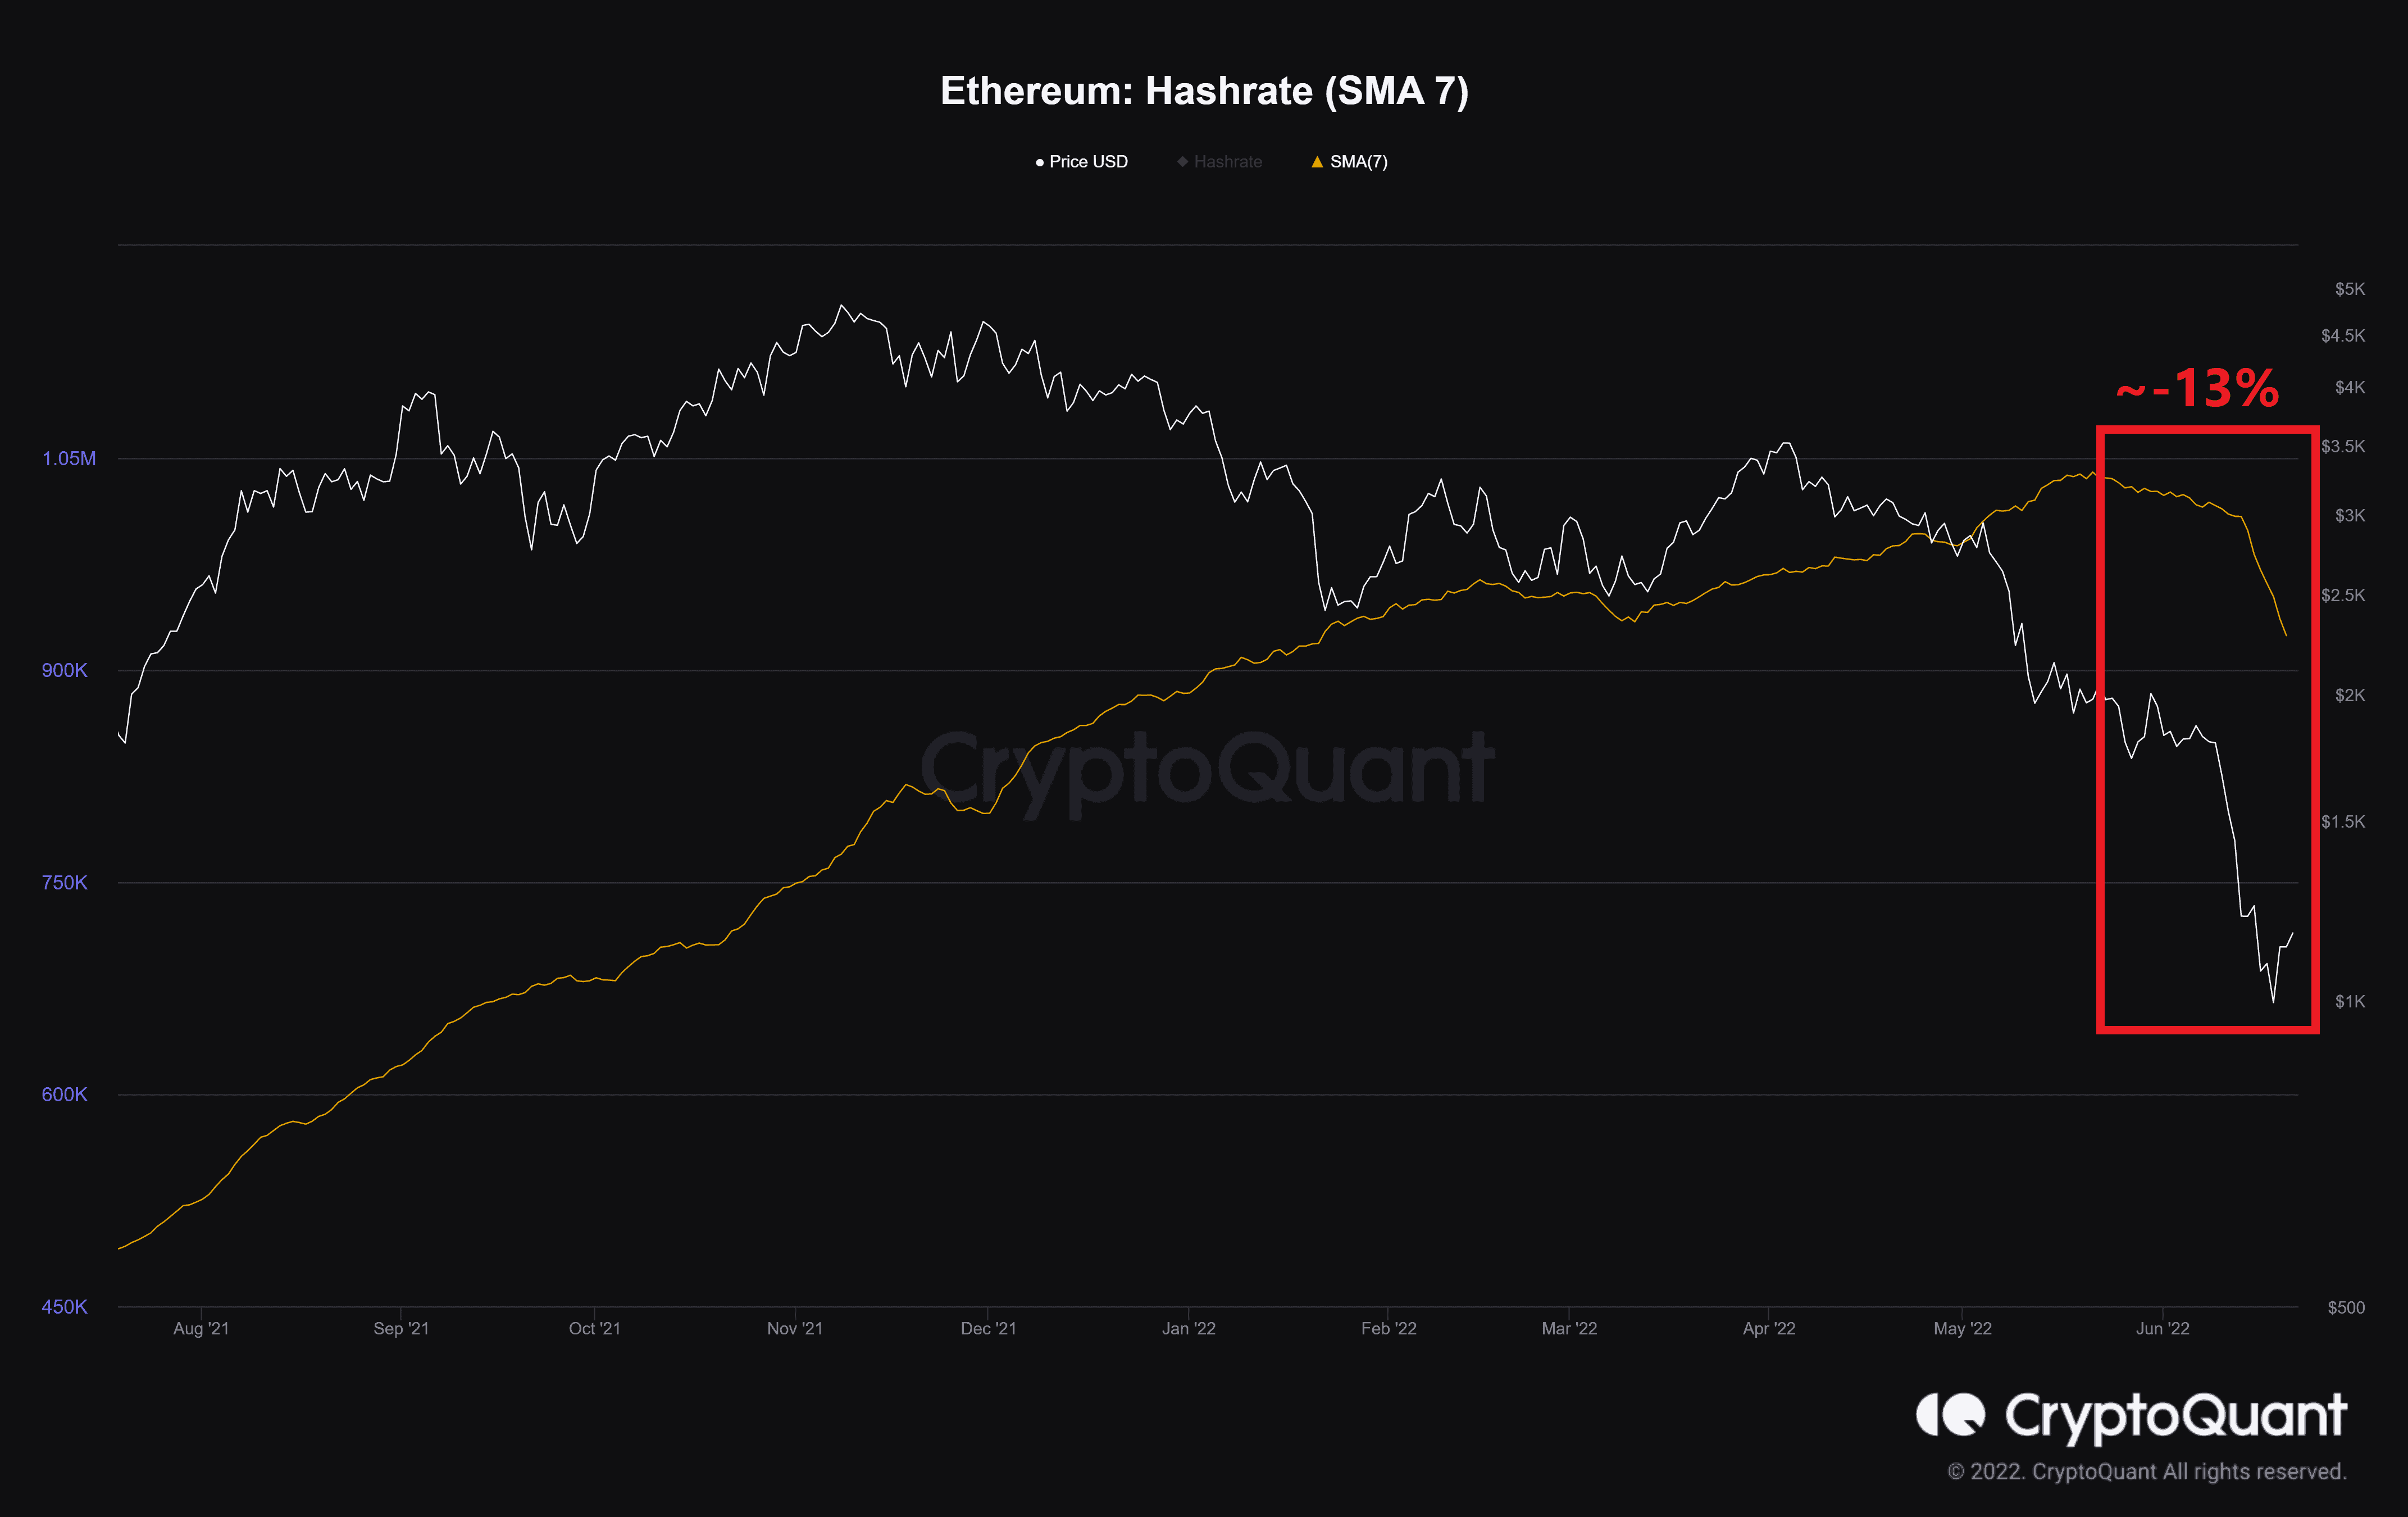
Hashrate (SMA 7)
ETH’s Hashrate has dropped by about 13 percent in the past month. It is an essential metric for assessing the many aspects of a blockchain network – more specifically, its security. The price falling and higher electricity costs have probably caused miners to turn off their devices in some areas. This happened last year after the Chinese bans and the start of the summer season.
Binance Free $100 (Exclusive): Use this link to register and receive $100 free and 10% off fees on Binance Futures first month (terms).
PrimeXBT Special Offer: Use this link to register & enter POTATO50 code to receive up to $7,000 on your deposits.
Disclaimer: Information found on CryptoPotato is those of writers quoted. It does not represent the opinions of CryptoPotato on whether to buy, sell, or hold any investments. You are advised to conduct your own research before making any investment decisions. Use provided information at your own risk. See Disclaimer for more information.
Cryptocurrency charts by TradingView.


