Chainlink on-chain activity ramps up after news of improved staking system
Chainlink just announced the first part of what has been branded as “Chainlink Economics 2.0”.
The announcement explains a revamp of the current LINK staking mechanics. The planned roadmap includes new staking features such as stake slashing and redistribution, user fee rewards, node delegation, and reputation tracking among others.
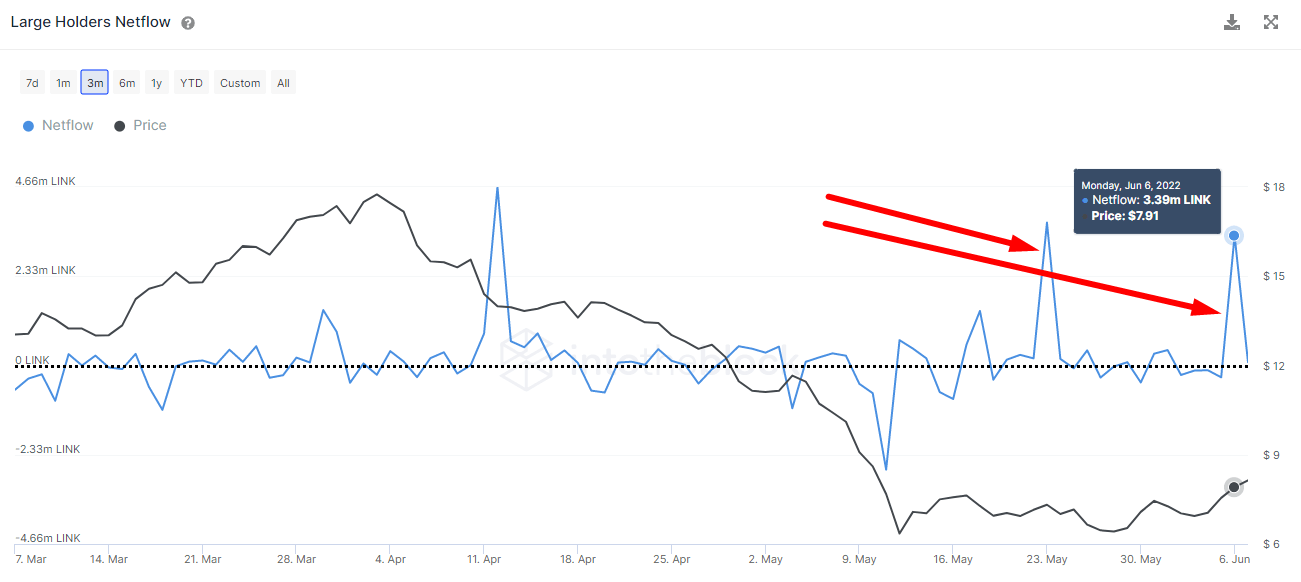
This positive news comes at a great moment since the bear market has treated LINK similarly to most crypto assets, with a -65% price decrease since the start of the year. Since the LINK price stabilized in the last month, the large holders (those holding at least 0.1% of the circulating supply) have taken advantage to continue accumulating more LINK.
After the staking news release, more than 3.39m LINK were absorbed by these whales, which is over $28M at current prices:
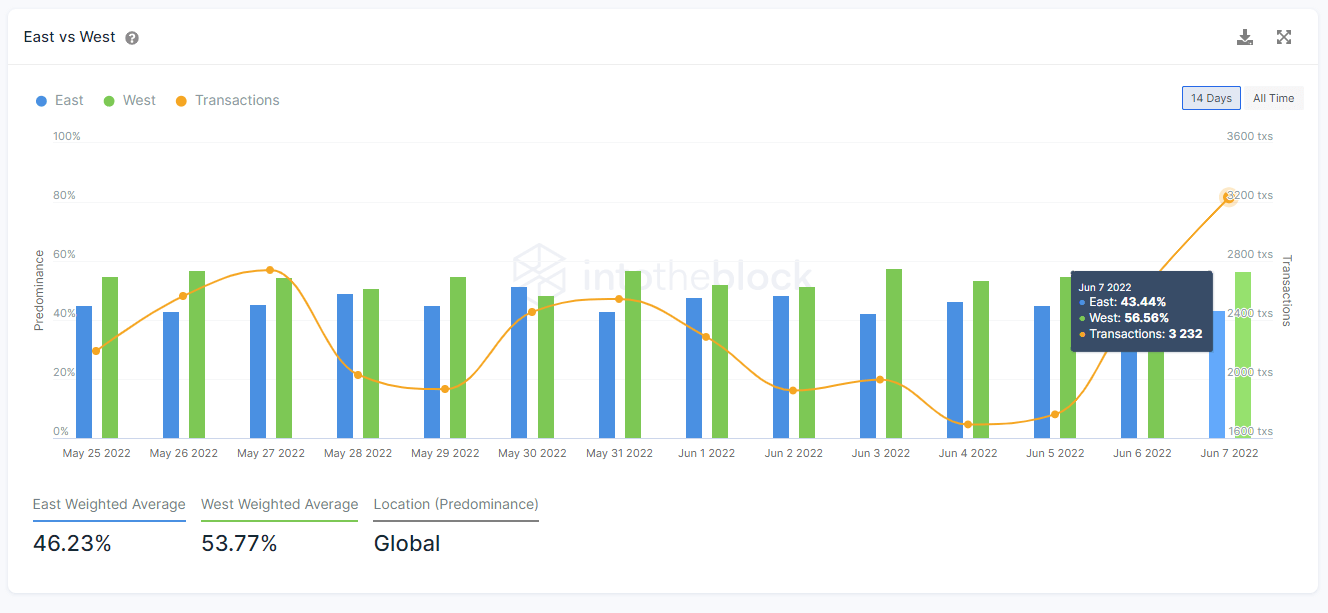
The interest over Chainlink has not only increased considerably among their large holders, and as can be seen in the next indicator, the daily transactions using LINK have increased 129% from an average of 2500 transactions daily to over 3200 just seen yesterday. The location predominance leans slightly towards West timezones. This is analyzed by taking into account the date of each transaction and categorizing it by west or east time zones.
Regarding potential resistance and support price levels, we like to check on-chain metrics instead of technical analysis signals. The on-chain equivalent to these resistances and supports can be read from an indicator called In/Out of the Money Around Price (IOMAP).
This indicator covers buckets within 15% of the current price in both directions. By doing so, the IOMAP spots key buying and selling areas that could act as support and resistance levels.
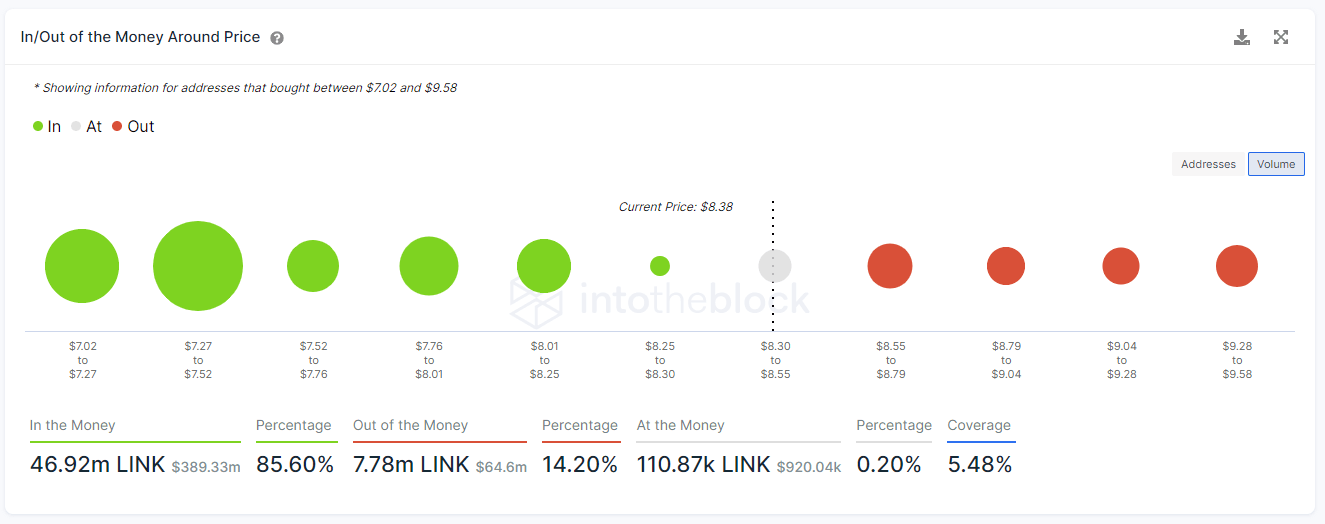
As can be seen in the chart above, most of the LINK supply (85.60%) acquired within 15% of the current price has been acquired below, and just 14.20% has been acquired above.
This could signal that the selling pressure is minimized in case that the LINK price would rise since most of the supply was acquired below and would continue being profitable. As behavioral economics points out, traders are more willing to let their positions run when they are in profit.
Leaving the short term aside and looking at the long term, LINK presents a particular holding distribution seen usually in crypto assets such as BTC or ETH, which are majorly treated as store of value assets from investors.
This indicator is the number of addresses holding for over a year which now represents the largest group of holders. In the chart below these are categorized as Hodlers, while those holding for 1 to 12 months are called Cruisers, while those holding for less than a month are named Traders.
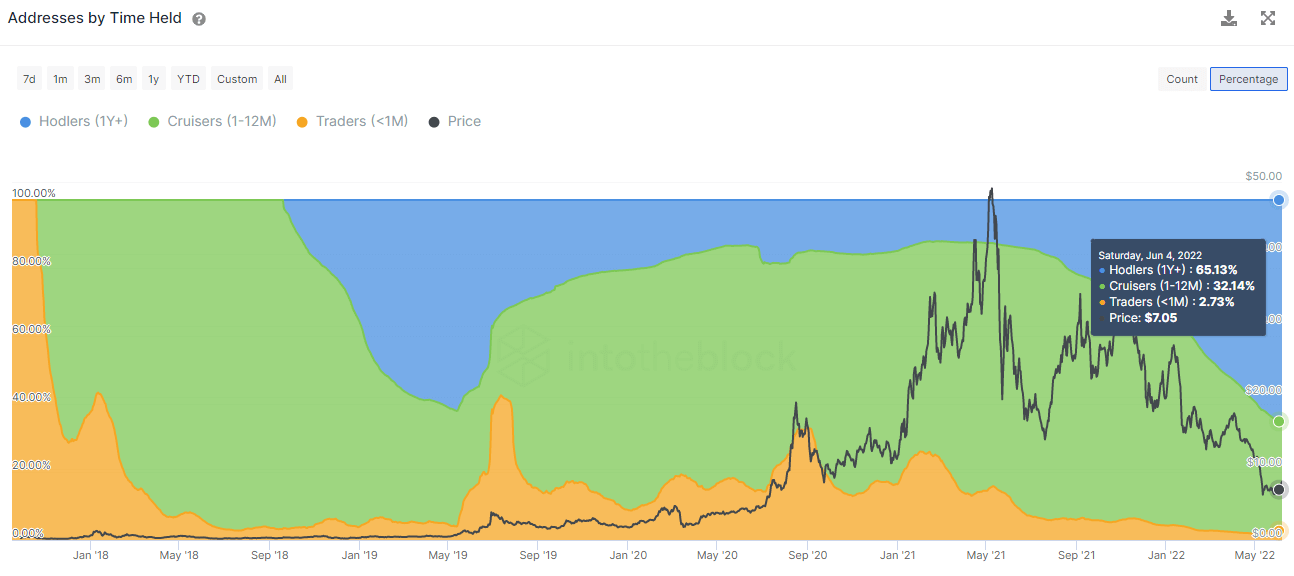
Addresses by Time Held as of June 8, 2022 according to IntoTheBlock Chainlink indicators.Right now 65% of the addresses with LINK have been holding for over a year. This shows the long-term confidence that most of the LINK holders have over the Chainlink ecosystem. Equally, the staking news lays out a plan for the long term, that will take time to execute and will start to see its fruits in the second half of 2022, but will continue to extend its planned capabilities probably further than 2022. It will be interesting to keep track of the developments advances and how LINK price reacts to it.


