What Next for the ANKR/USDT Pair?
Bearish ANKR price predictions are yet to go away after the daily candles on the chart of the token’s pairing with Tether started the evolution into a bearish pattern. The ANKR/USDT pair failed to accompany the top cryptos to the upside as it fell 3.3% on the day.
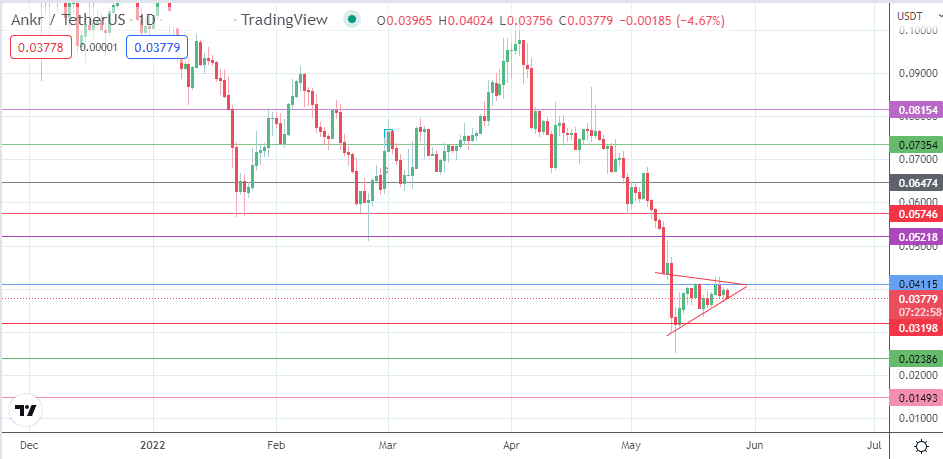
The emergence of this pattern follows the decline of the bearish flag on the daily chart. This has resulted in a breakdown forming the pattern’s pole. Subsequent price activity has condensed into a narrow consolidation area, with a series of tests on the 0.04115 resistance that failed to uncap that barrier. This drop now puts the pair in a position where the bears have the momentum to mount an assault on the pennant’s lower border.
The announcement that ANKR had partnered with Tron to provide an enabling environment for Tron’s developers to build scalable, secure and high-throughput decentralized applications did not do much to boost bullish ANKR price predictions. Presently, the price of ANKR and perhaps the majority of crypto tokens in the market are solely controlled by the general market sentiment and not by inherent fundamentals governing each token.
ANKR Price Prediction
A breakdown of the pennant’s lower boundary will produce a move that faces a quick test of the 0.03198 support level (13 May low). This support level and the 0.02386 pivot must be degraded before the bears can glimpse the measured move’s completion point at 0.01493 (6 February 2021 low).
On the other hand, a bounce on the pennant’s lower border and clearance of the 0.04115 resistance invalidates the pattern. It also creates access to the 0.05218 resistance level (24 February low). Above this level, additional barriers to the north are seen at 0.05746 (24 January and 22 February lows) and at 0.06474. The latter marks where the previous highs of 25 January and 2 May are found.
ANKR/USDT: Daily Chart