Bitcoin (BTC) Consolidates Near $30,000 in Choppy Trading
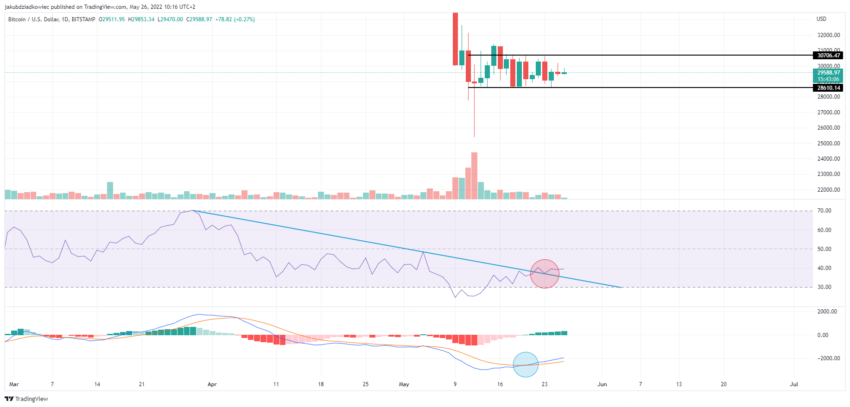
Bitcoin (BTC) has been in a sideways trend since its sharp decline on May 12. The ongoing consolidation is playing out in the area between $28,600 and $30,700, with BTC regularly bouncing off the peaks and lows of this range.
Bitcoin ended the decline with a local low at $25,400 on May 12. The daily doji candle from that day had a very long lower wick, and the capitulation was confirmed by the largest daily trading volume since May 19 2021 (blue arrow).
Since then, bitcoin has been trading in the $28,600 to $30,700 range (black lines) with a false breakout on May 15. The daily close of the BTC price has not been below $28,681, which remains in line with the so-called Confluence Floor Model that Be[in]Crypto recently wrote about.

BTC technical indicators
The technical indicators on the daily timeframe give mixed readings typical of a consolidation period. On the one hand, the RSI is at the 40 level and slowly rising in the neutral area. Meanwhile, the MACD histogram is still in a very overbought area.
On the other hand, RSI seems to have broken out above the falling resistance line and validated it as support (red circle). Moreover, MACD has made a bullish cross (blue circle) and has been generating increasing bars of positive momentum for the past seven days.

Technical indicators in the four-hour chart also confirm the short-term sideways trend. The RSI chart since May 12 respects a parallel channel within a narrow range, the median of which is almost perfectly at the neutral level of 50.
The MACD histogram is almost exactly at the level of total neutrality 0, and the bars of negative and positive momentum are becoming weaker. This is also confirmed by the BBWP volatility indicator, which is approaching the blue minimum volatility area (arrow).

Bitcoin symmetrical triangle
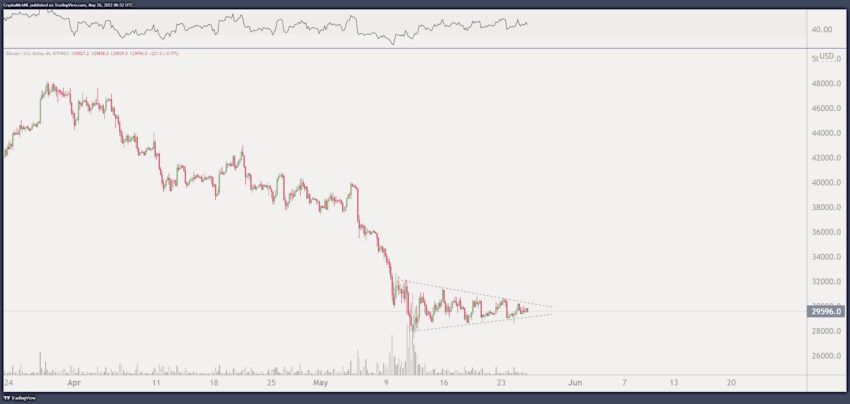
The four-hour chart also shows a view of a symmetrical triangle. Statistically, a breakout and breakdown from this pattern is equally probable. At the press time, the BTC price is again testing the lower edge of the triangle.
If a breakout occurs, the target will be the CME gap from May 6 to 9 near $35,000. If a breakdown takes place, the target will be the $25,000 level.

Cryptocurrency trader @CryptoMichNL drew a similar symmetrical triangle formation on Twitter. He wrote that “a breakout is coming relatively soon for #bitcoin.” He then added that the trigger for positive price action could be a drop in inflation or an increase in jobless claims.
In his opinion, such macroeconomic factors could lead to a reduction in monetary tightening. This, in turn, would have a positive impact on the broad market for “risk-on assets,” including bitcoin and the cryptocurrency sector as a whole.

For Be[in]Crypto’s previous bitcoin (BTC) analysis, click here.
Disclaimer
All the information contained on our website is published in good faith and for general information purposes only. Any action the reader takes upon the information found on our website is strictly at their own risk.


