ETH Price Analysis: Crash Continues as Negative Bias Holds Under $3,000, Over 12 Million ETH Locked in Ethereum 2.0 Deposit Contract
- ETH is losing over 4% in 24 hours and over 5% weekly leading other altcoins with a mixed dynamics
- Per CoinMarketCap the current price of $ETH is $2,814
- The ETH 2.0 deposit contract now has a 10% lock on Ethereum’s circulating supply
The overall cryptocurrency market is treading on water as global risks continued to escalate. Ethereum (ETH), the number 2 cryptocurrency by market cap remains affected by the crypto-wide pullback. ETH is losing over 4% in 24 hours and over 5% weekly leading other altcoins with mixed dynamics. Ether now heads for a substantial monthly loss on heavy correction after failing to break above the $3,581 mark and daily MA 200 zone. At the time of analysis, ETH/USD crash continues as negative bias holds under $3,000. Per CoinMarketCap the current price of $ETH is $2,814. The ETH 2.0 deposit contract now has a 10% lock on Ethereum’s circulating supply. This translates to over 12 million ETH locked in Ethereum 2.0 deposit contract. The sum is valued at $34.391 billion and represents almost 10% of Ethereum’s entire circulating supply of 120,576,553 ETH. The 12 million Ethereum now held in the ETH 2.0 deposit contract will not be available until the Merge is completed. The Merge, on the other hand, has been postponed indefinitely as Ethereum developers focus to finalize.
Key Levels
Resistance Levels: $3,500, $3,200, $3,000
Support Levels: $2,700, $2,500, $2,300
ETH/USD Daily Chart: Ranging
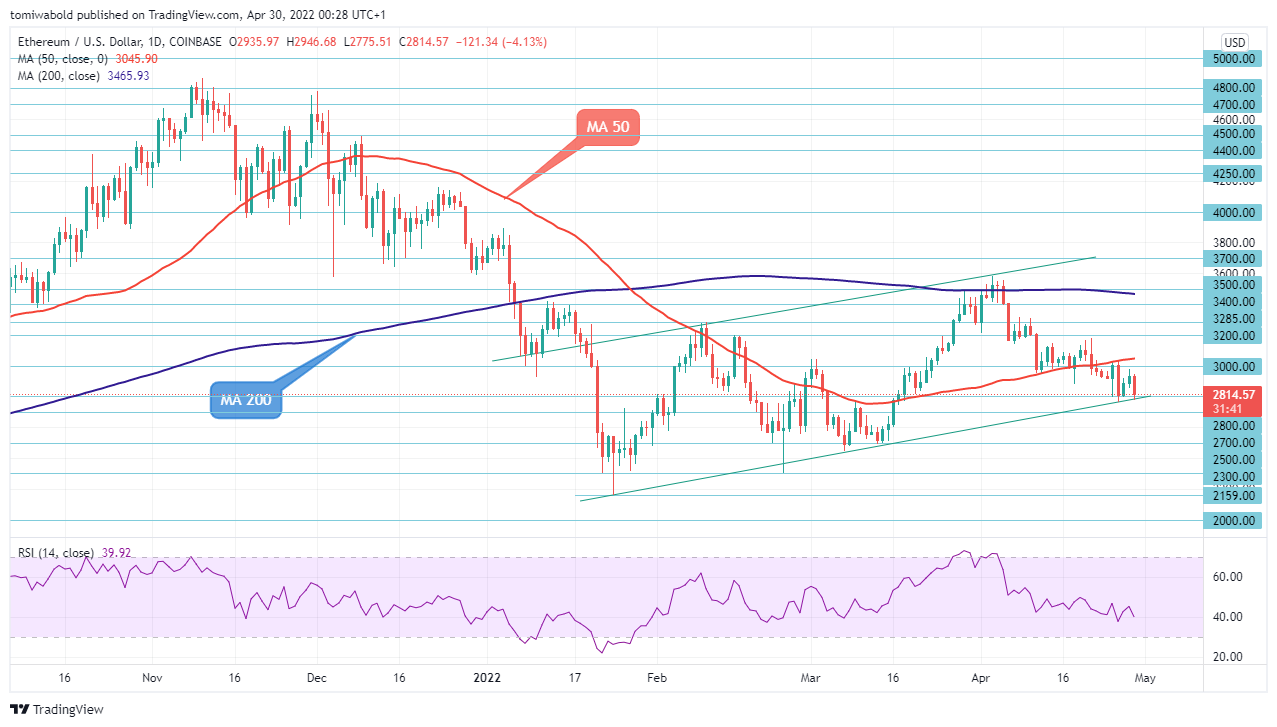 ETH/USD Daily Chart
After failing to close above the MA 50 ($3,030) on April 25, Ether has been steadily declining. Today’s sell-off to $2,775 low has moved the price near oversold levels and into the negative zone of March 2022, bolstering the case for a downturn. A drop below today’s low might lead to a test of the $2,500 support level.
In the near term, if the RSI indicates oversold circumstances at 30, an upside correction or some stability should not be unexpected. If the next support level of $2,700 holds, the price may try again for the $3,000 range before returning to the MA 50 ($3,050). Bulls may attempt to eliminate downside risks and revive the uptrend over above MA 50.
ETH/USD 4-Hour Chart: Bearish
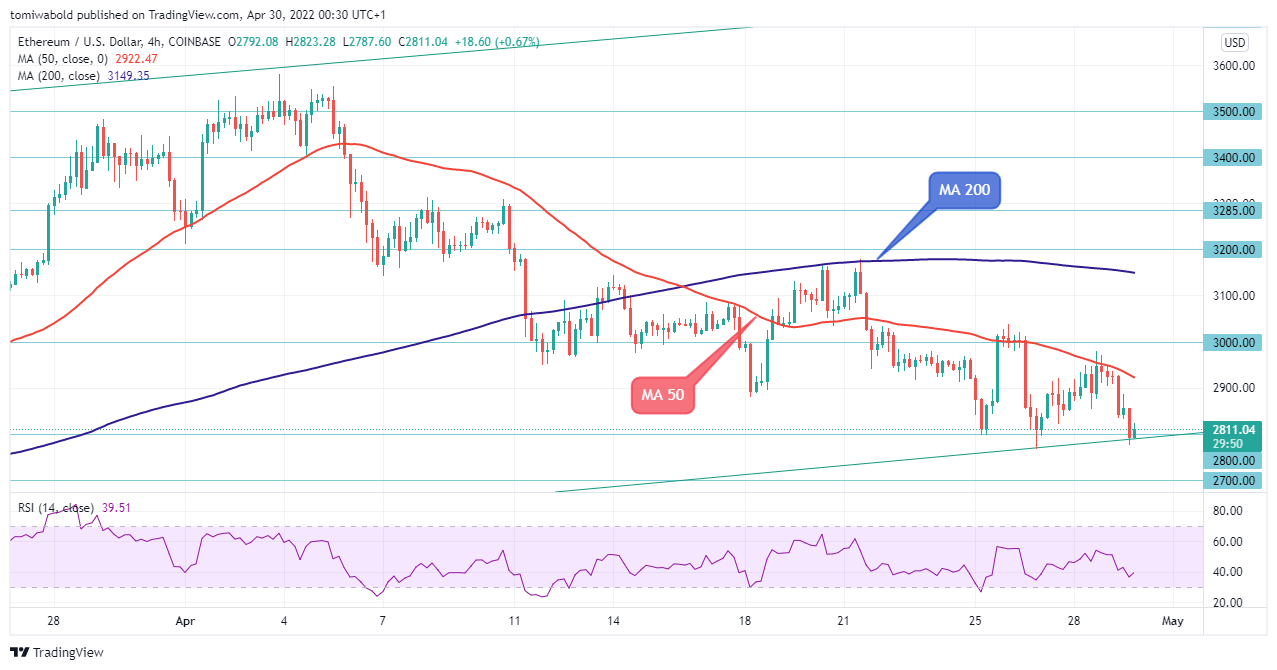 ETH/USD 4-Hour Chart
After peaking at $3,581 at the beginning of the month, ETH/USD has seen a downward trend. The price also fell below the 4-hour MA 200 and 50, which were at $3070 and $3050 respectively, and to lows of $2,775. More losses might drive the price down to $2,700 before collapsing to $2,500.
The RSI has reached oversold levels of 25 in April, which could indicate that a relief rally is in the works. ETH might bounce upward again, facing resistance at $3,000 ahead of the MA 200 ($3150), before resuming the rise to a yearly high of $3,581. Finally, because of the recent market downturn, the Ethereum price might consolidate for a while.
Note: Kryptomoney.com is not a financial advisor. Do your research before investing your funds in any financial asset or presented product or event. We are not responsible for your investing results
Image Credit: Shutterstock


