How Current Sideways Market is Likely to Playout
Solana prices have dropped by more than 30 per cent in April and are currently looking likely to finish the session below the opening price. This is despite showing signs of recovery yesterday when it closed with a gain of 1.75 per cent.
Solana Price Prediction
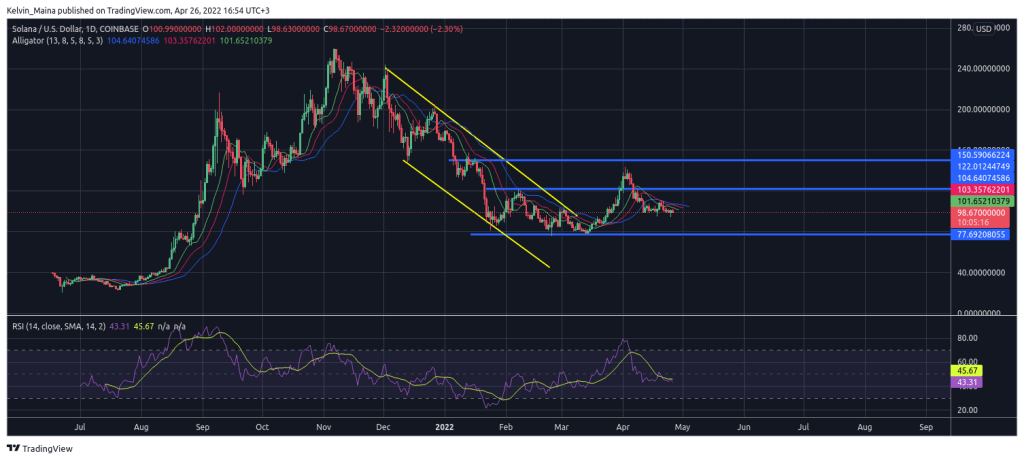
Solana has traded in a sideways market since April 12. The prices have also not had any momentum during that period. In today’s trading session, the prices are down by three per cent. However, the prices have only managed to wipe yesterday’s gains. Based on past price action, there is a high likelihood of another bullish move that is likely to maintain the current sideways market.
However, Looking at the bigger picture, the cryptocurrency is still in a strong long-term bearish market. The cryptocurrency also recently broke the $122 resistance level. However, it failed to reach the $150 price level, which would have indicated a trend reversal. The Williams Alligator also shows a trend that, although still bearish, has lost all its momentum. This is confirmed by the RSi indicator which shows prices are in neither buy nor sell regions.
Using the chart, I expect the long-term bearish trend to continue. There is also a very high likelihood that the prices will be able to hit the $77 support level. The bearish trend move prediction is due to recent price action that has shown that the cryptocurrency is able to trade in bearish flags and sideways market before resuming its long-term trend.
However, if the prices move above the $110 price level of the sideways market, there is a high likelihood of a sustained bullish move. It will also mean my analysis has been invalidated. This is because trading in a sideways market is much riskier than one that is already on a trend. It will also mean a chance of hitting the $150 price level will be a possibility. Due to the cryptocurrency being on a week’s long sideway market, any movement may also come due to fundamental factors and not due to technical factors such as demand and supply.
Solana Daily Chart
