BTC, ETH, XRP, AVAX and DOT Price Analysis for April 6
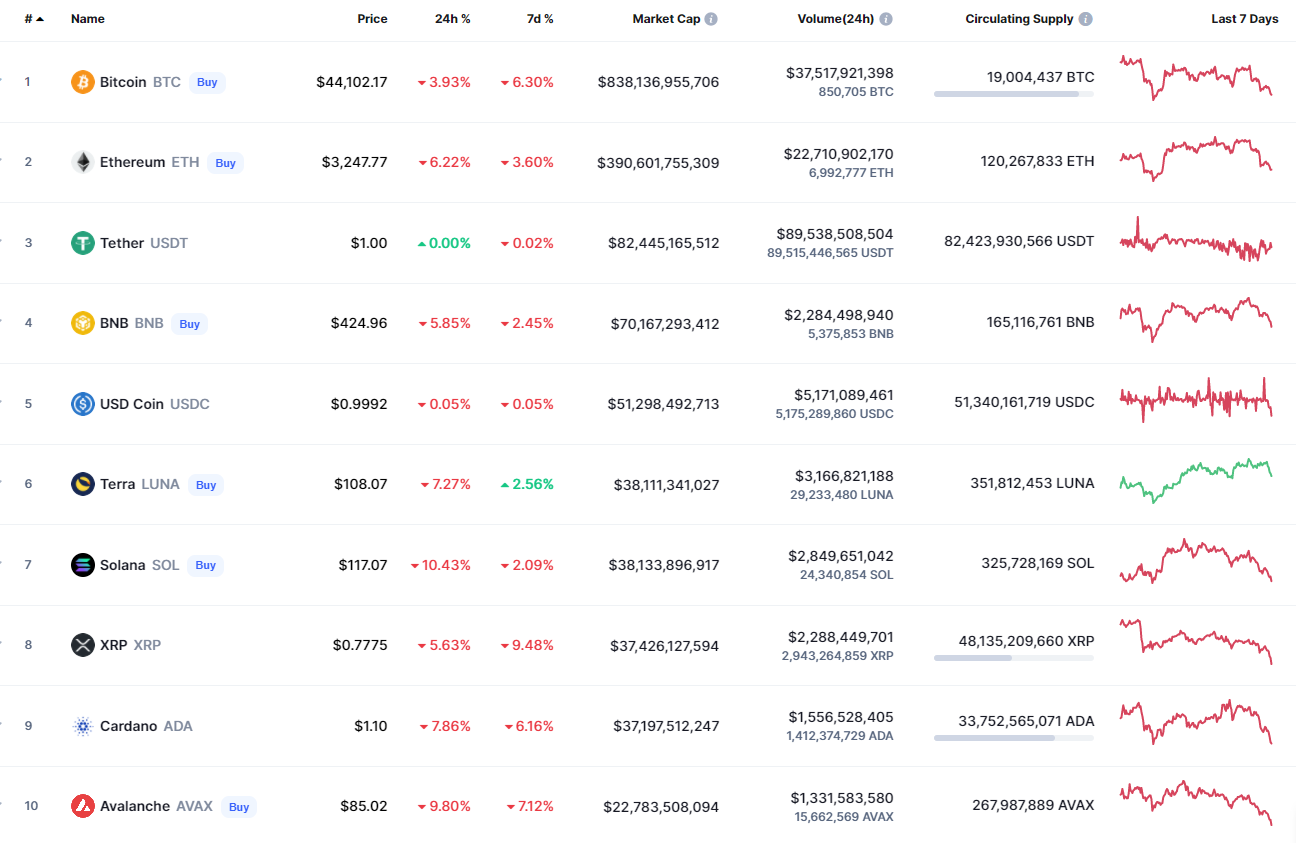
Bears have gotten back in the game as all coins are now in the red zone.
BTC/USD
The rate of Bitcoin (BTC) has declined by 4% since yesterday.
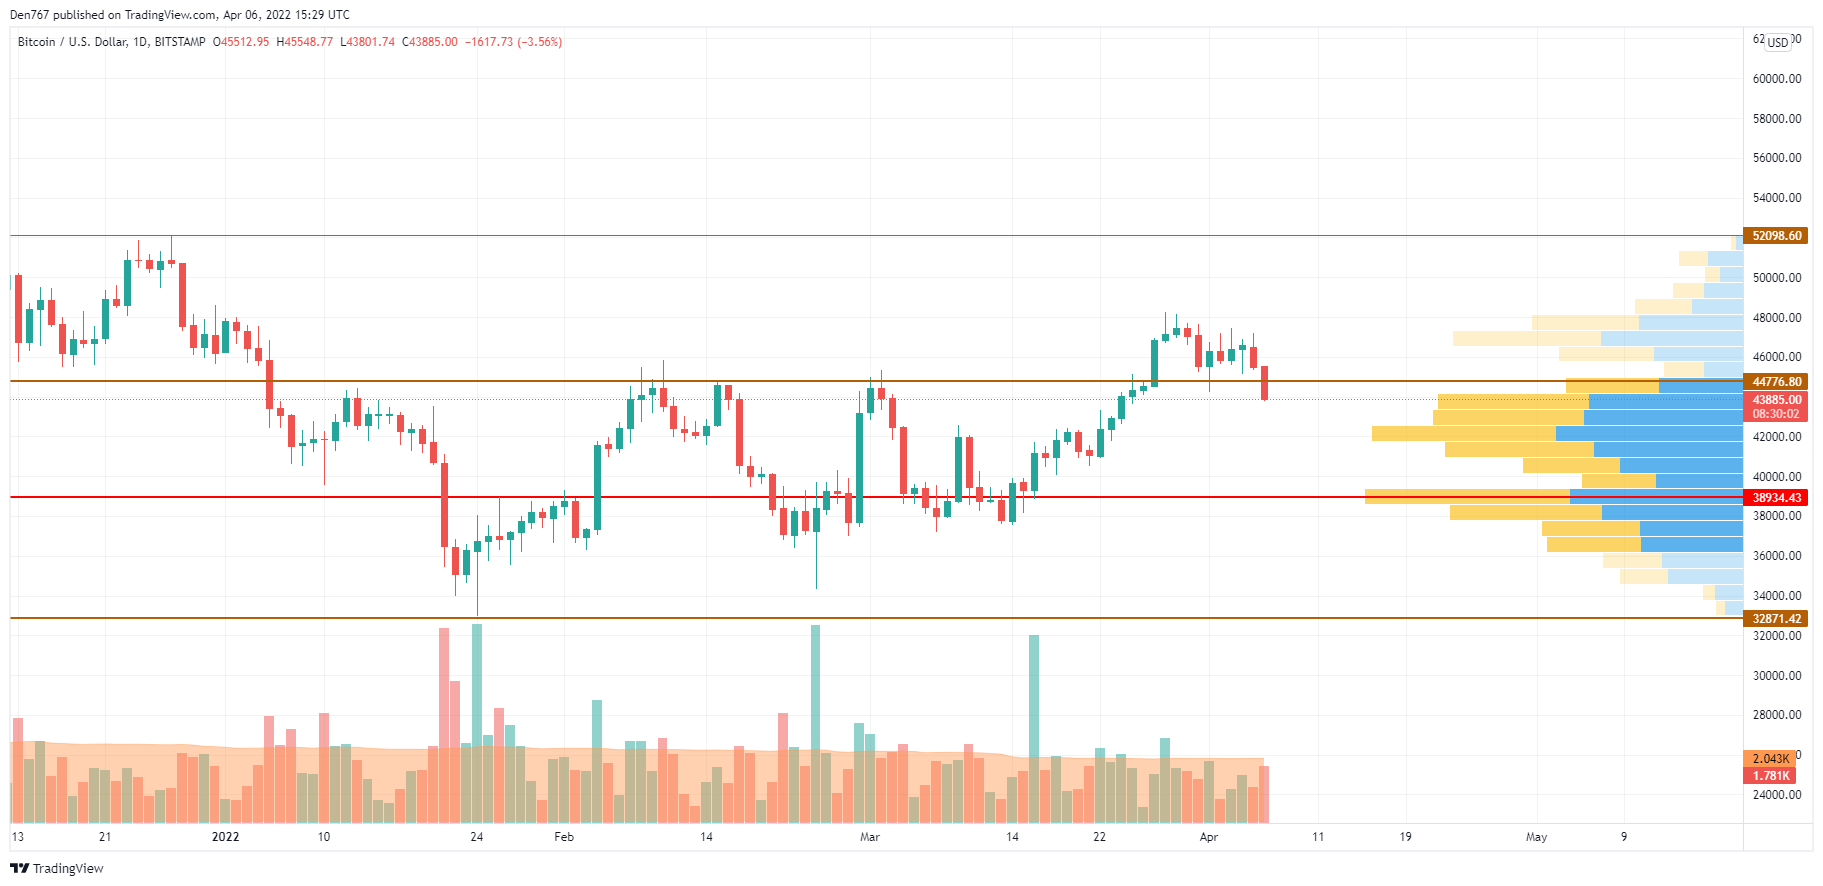
On the daily chart, BTC has broken the level at $44,776 to return to the wide channel where it located for a long time. If bulls cannot come back above this mark, the drop may continue to the zone of the most liquidity around $40,000 by mid-April.
Bitcoin is trading at $43,962 at press time.
ETH/USD
Ethereum (ETH) could not withstand the fall of Bitcoin (BTC), going down by 6.53% over the last 24 hours.
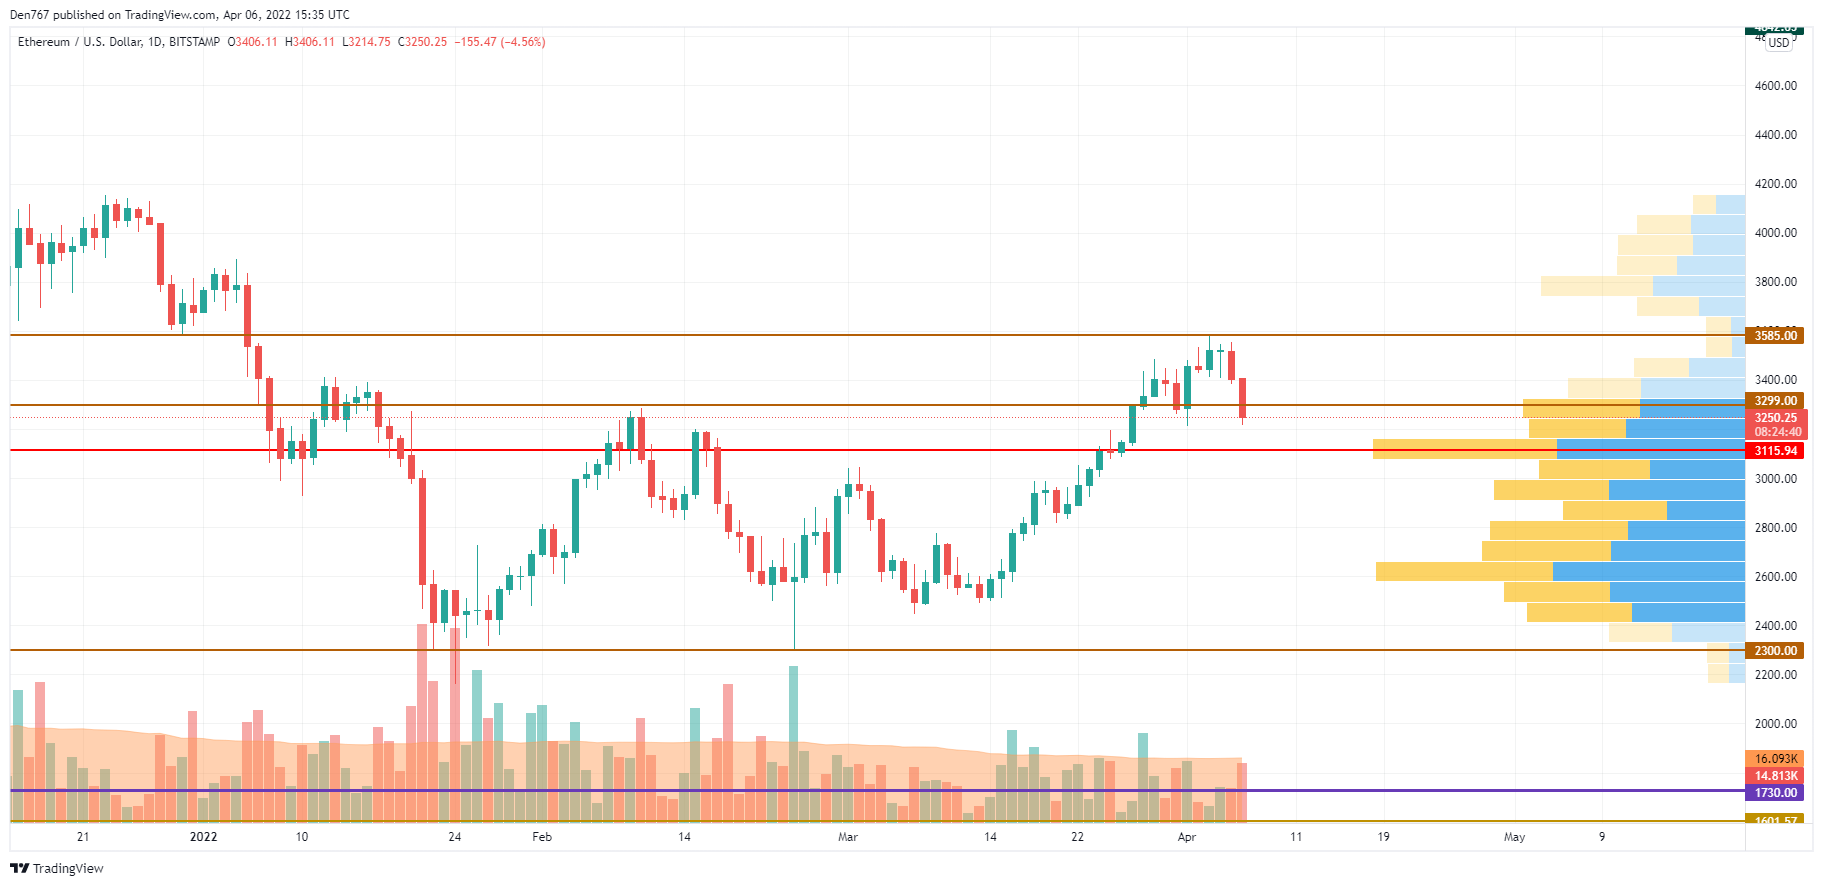
Ethereum (ETH) is also on the way to its support level at $3,115, which serves its liquidity. However, if sellers’ pressure continues and the daily candle fixes below the $3,000 mark, one can expect a sharp price decline to $2,700-$2,800 soon.
Etheruem is trading at $3,243 at press time.
XRP/USD
XRP is not an exception to the rule, falling by 5.62%.
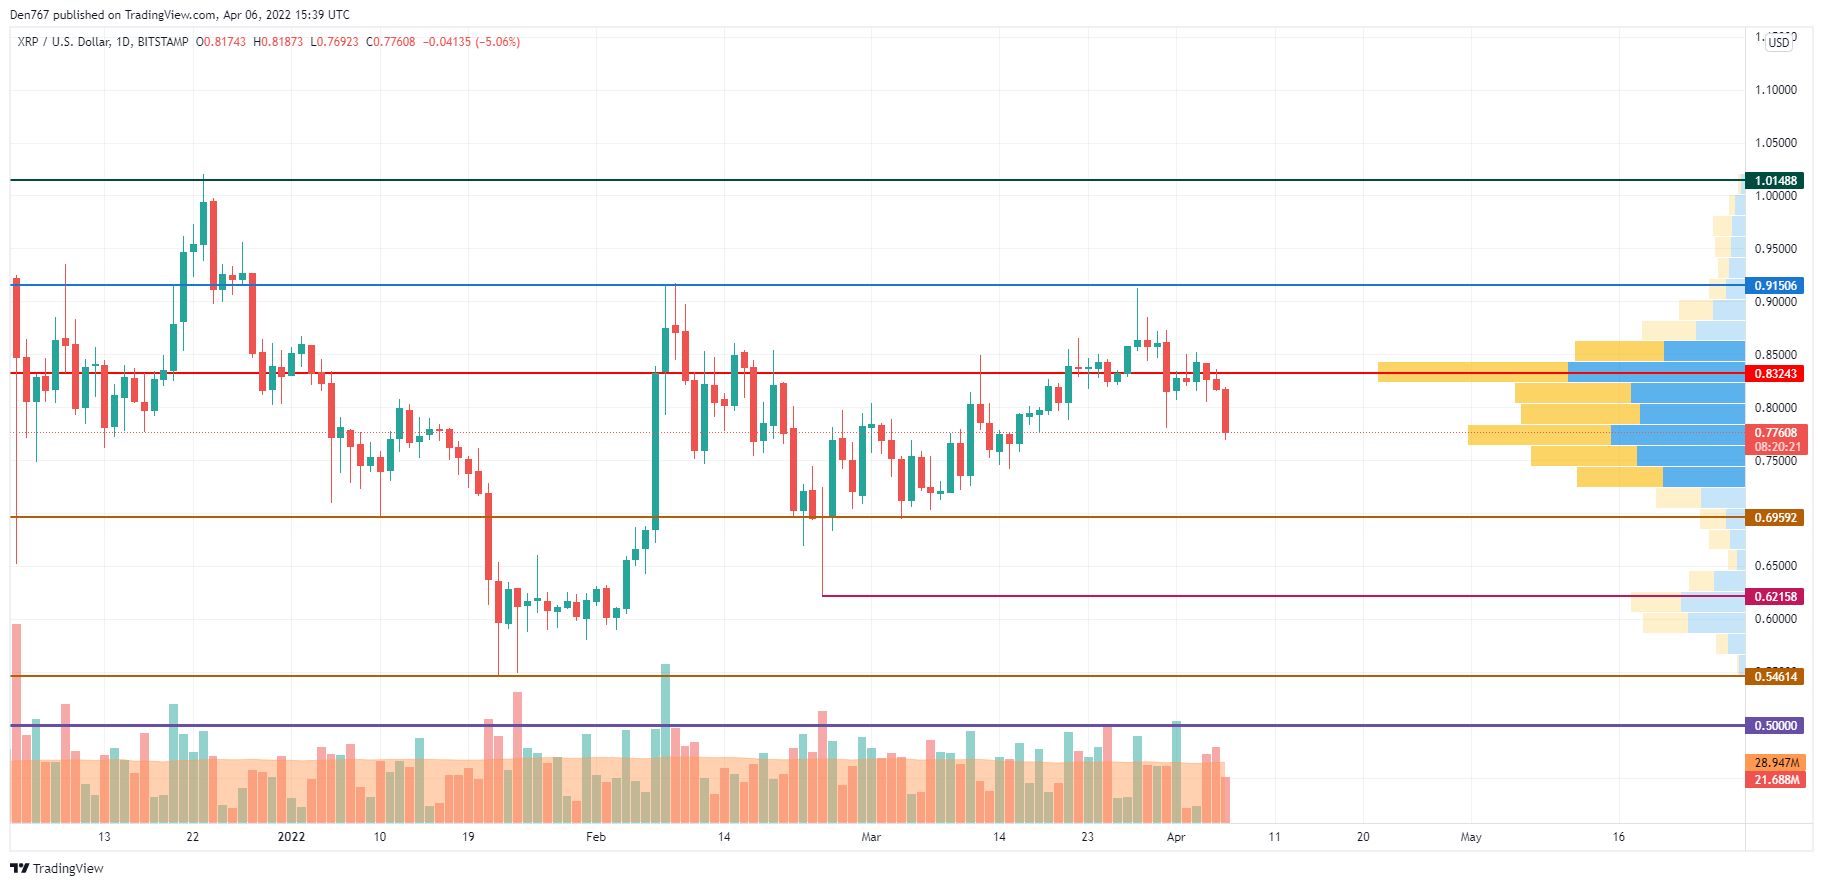
XRP is looking worse than BTC or ETH as the price has broken the $0.80 mark and is currently trading below it.
This level is crucial for bulls as, if they lose it, there is a chance to see the test of the zone of $0.70-$0.75 within the nearest days.
XRP is trading at $0.7769 at press time.
AVAX/USD
Avalanche (AVAX) is the biggest loser from the list with a drop of 9.35%.
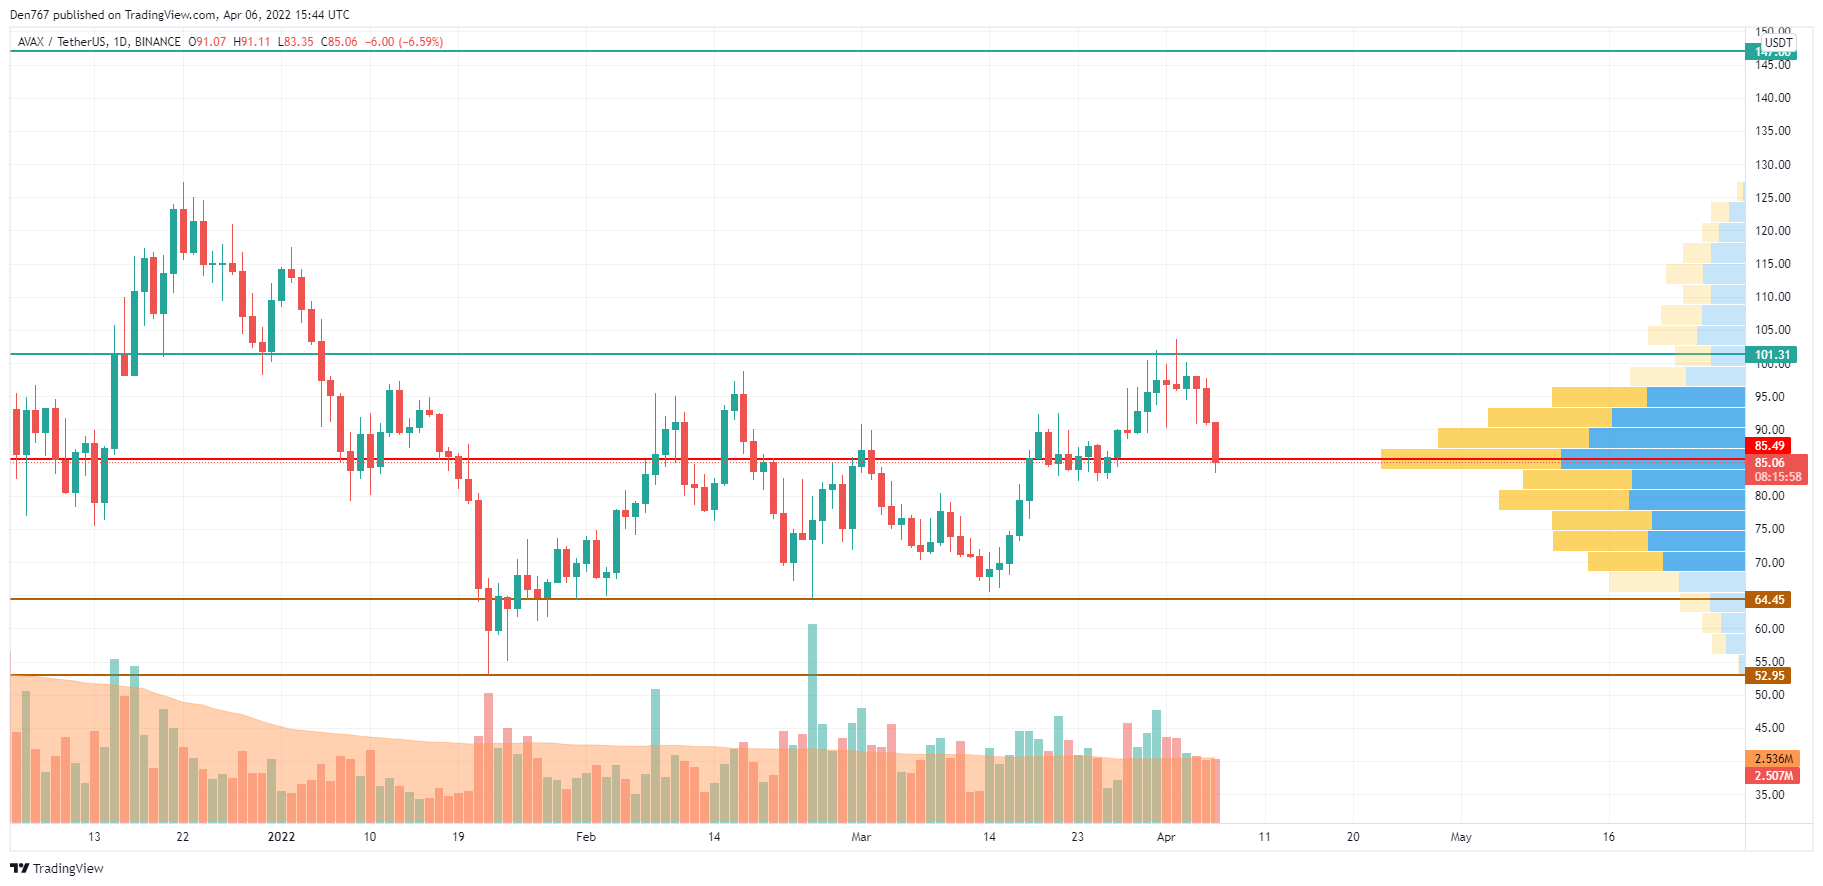
AVAX has touched the $85 mark, which is the mirror level on the daily chart. Bears are running out of energy. However, if they keep pushing the price more profoundly, there are fewer chances that bulls can hold $80. All in all, the pressure may lead to a further drop to $75 until the end of the week.
AVAX is trading at $85.32 at press time.
DOT/USD
Polkadot (DOT) is also going down, losing 8.82% of its share.
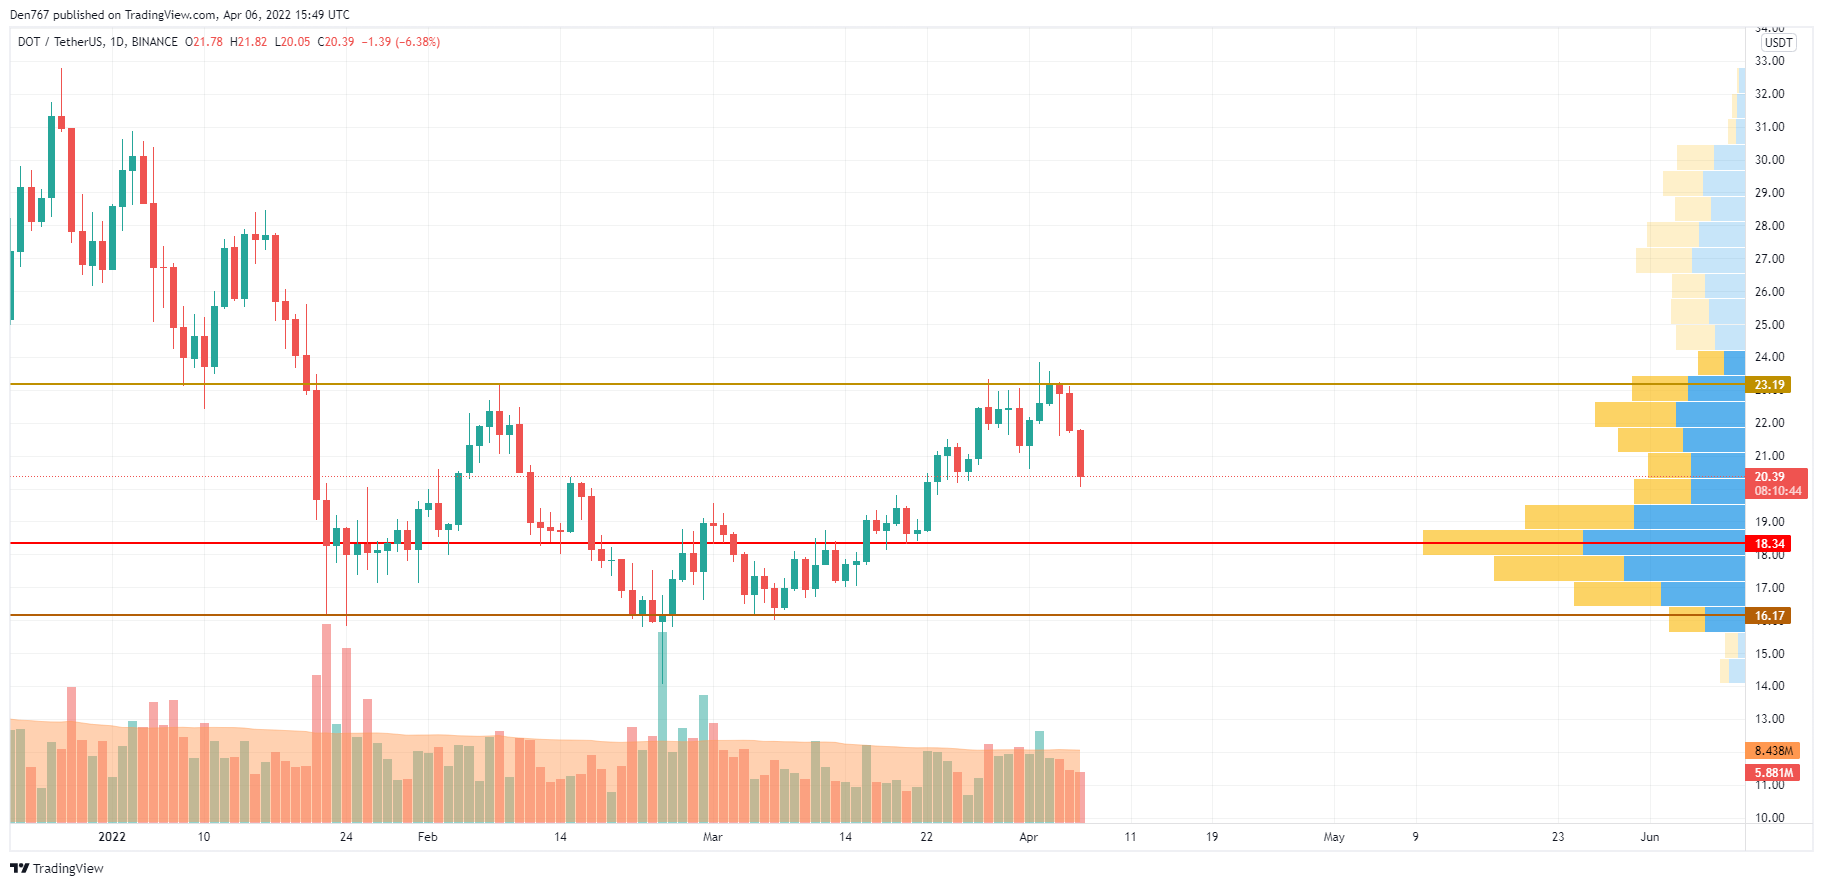
DOT has reached the zone of $20 against the declining selling trading volume. At the moment, one needs to pay close attention to where the daily candle closes. If DOT continues the decline, one may expect a reaction in the zone of $18-$19.
DOT is trading at $20.40 at press time.


