Bitcoin: Relief Rally Then Dip (Cryptocurrency:BTC-USD)
Tevarak/iStock via Getty Images
In hindsight, the laser eyes were Bitcoin’s (BTC-USD) top signal.
Laser eyes top (Google Trends)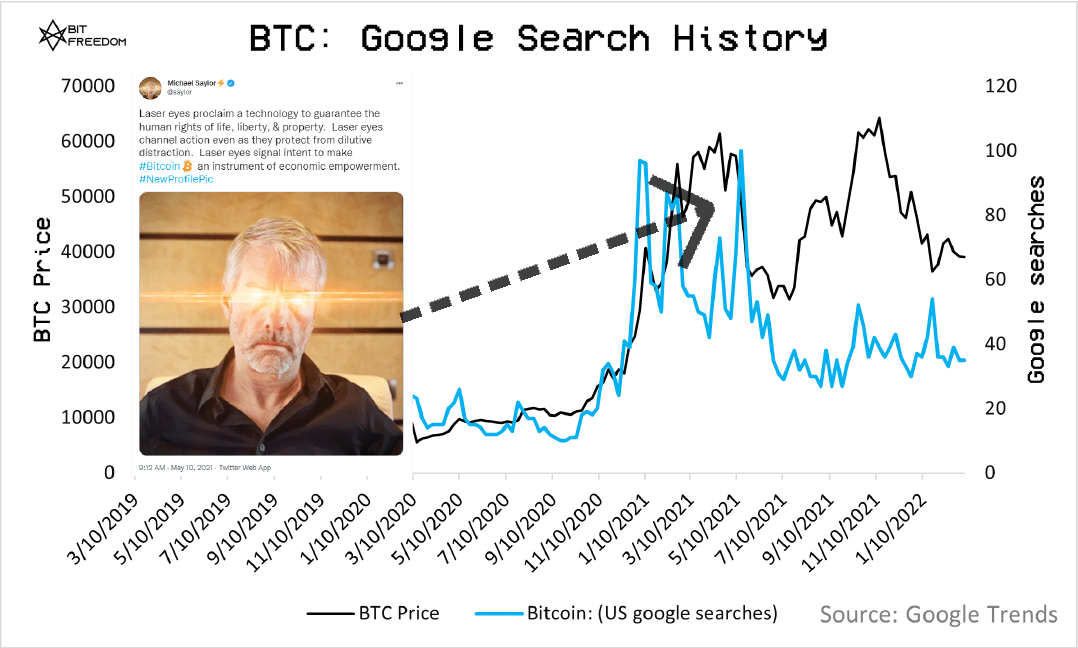
Bitcoin is still young and competing against multi-century monetary premiums held by gold (GLD), bonds, and fiat currencies. As a result, Bitcoin is currently more correlated to the NASDAQ (QQQ) than it is to gold.
For Bitcoin to increase or maintain stability in an uncertain market, investors need to shift to view Bitcoin as a hard asset rather than a speculative investment.
At present, the beginning of this sentiment shift is creating demand for Bitcoin. However, this demand has not been enough to outpace sell pressure from allocators who view Bitcoin as risk-on.
Price Cycle Theory
The outlook for traditional markets looks bearish, and Bitcoin has room to move lower. How much lower depends on the extent to which equity and credit markets unwind and commodities peak, along with monetary policy decisions by global governments.
The chart below displays Bitcoin’s Elliott waves and logarithmic growth curves, as well as a fractal projection taken from Bitcoin’s price movements throughout 2020:
Bitcoin logarithmic growth curves (TradingView)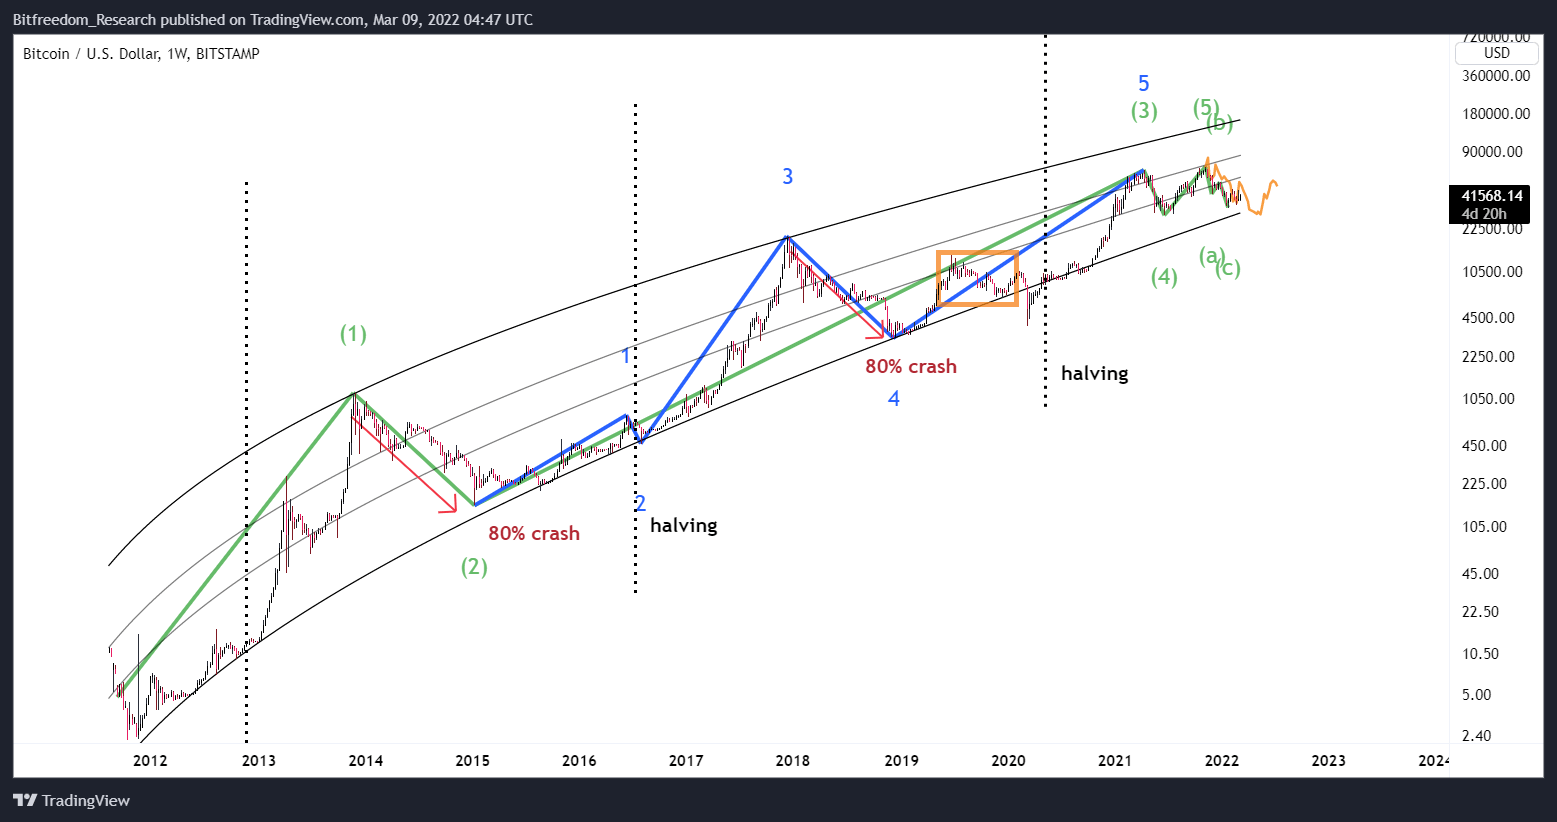
Given the similar high-fear economic environments, it seems likely that Bitcoin will follow its 2020 movement and accumulate in the 30Ks until anxiety settles.
Additionally, this accumulation movement would line up with Bitcoin’s price cycle theory. In accordance with Bitcoin cycles, halving events routinely lead to parabolic highs, then 80% crashes.
Notably, now that Bitcoin is an over $700 Billion asset, it seems that 50% cycle crashes have replaced the previously standard 80% crash.
Short term TA shows Bitcoin is poised for a relief rally; however, in the long term. Bitcoin needs more time to accumulate near its bottom logarithmic growth curve. As we can see in the chart above, this curve has served as Bitcoin’s price floor in previous bear markets.
Reflexive Rally
Bitcoin’s move from November all-time high to Jan 22nd $35K close likely started a larger bear market. If Bitcoin follows the Elliott waves charted below, then it can reach $28K sometime in the next couple months.
Elliot wave bear market (TradingView)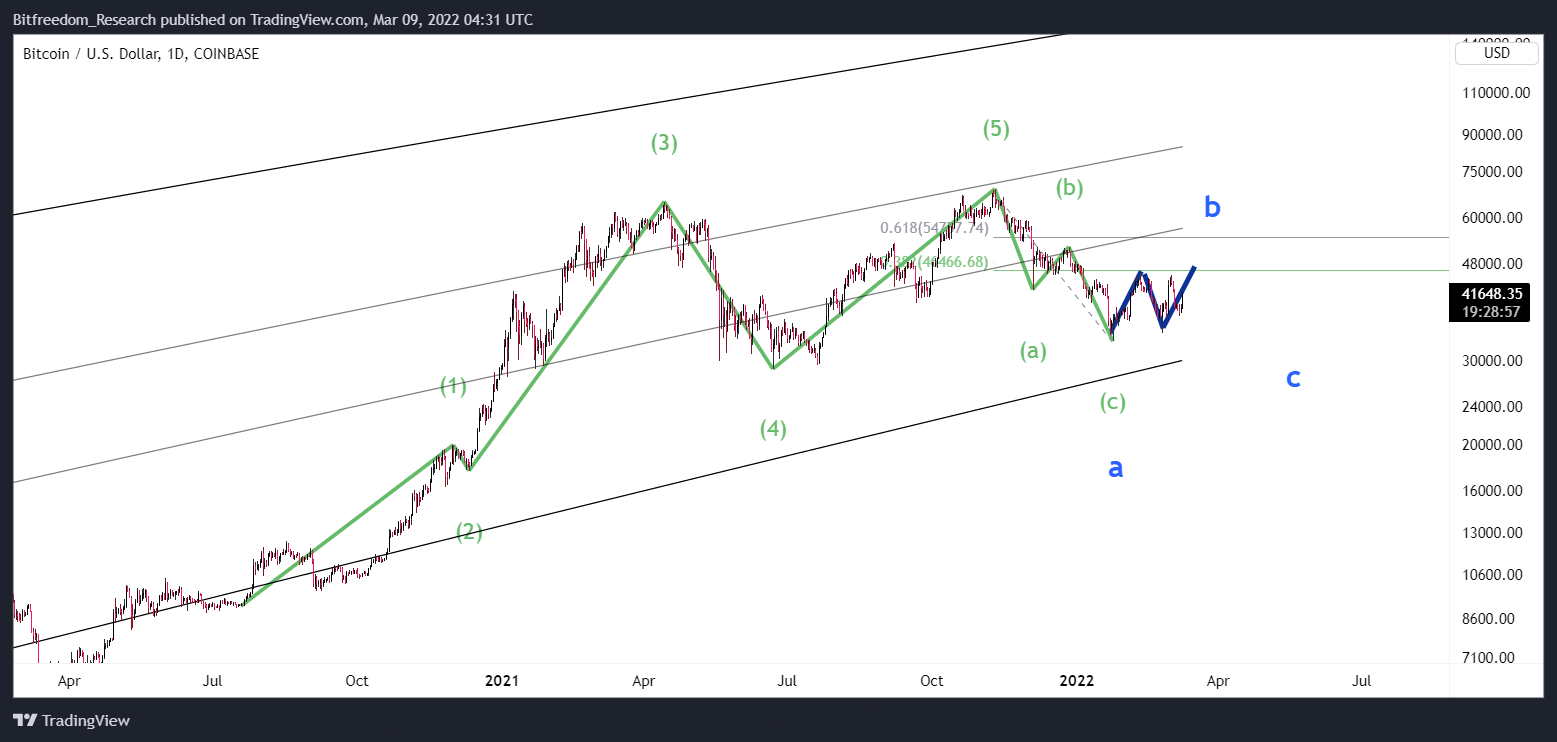
At the time of writing, $38K is Bitcoin’s pivot point. Sustained trading above $38K generates FOMO buy-pressure, while movement below $38K turns the market bearish.
VPVR point of control (TradingView)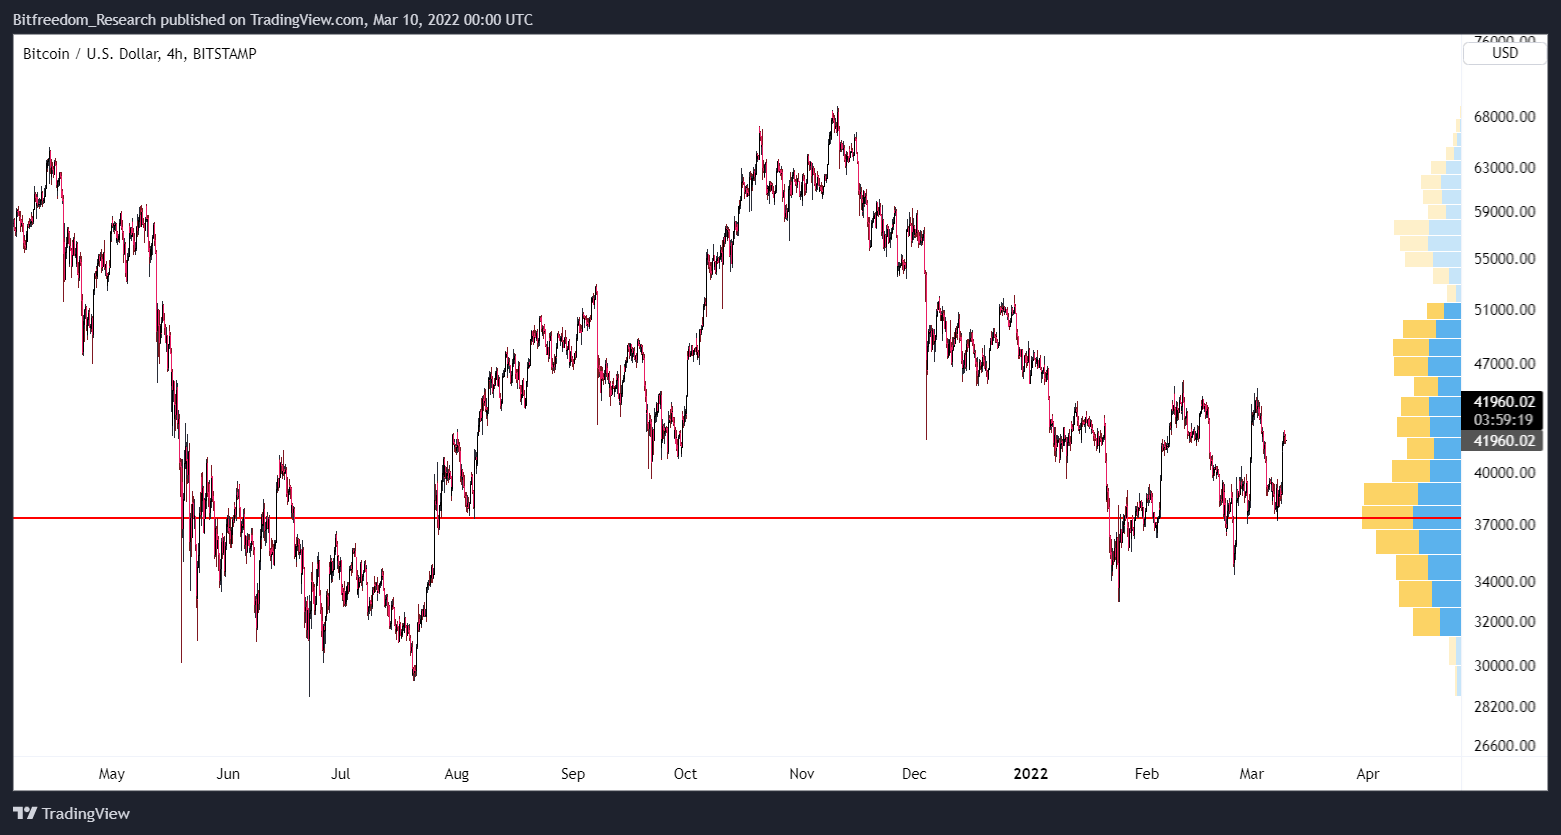
During times of stress (such as a war) sentiment can fluctuate wildly. The currently high-fear market has led to volatile price movements for Bitcoin over the past 2 months.
This shows Bitcoin and the crypto market are still fragile. Therefore, expect $38K to act as critical support during Thursday’s CPI print. Inflation is expected to come in around 7.9%, which will likely hurt Bitcoin’s bullish momentum.
Bitcoin Tailwinds
- A developing positive correlation with commodities (specifically gold, silver, & precious metals).
- Censorship resistance, which may be increasingly important as governments shift to become increasingly dirigiste.
- Increasing long-term holder / illiquid supply growth.
- Increasing Bitcoin dominance.
- Miners and lightning network developers continue to innovate and grow.
Bitcoin Headwinds
- Increasing oil prices & a strengthening dollar.
- Nearly inverted 10Y-2Y yield curve.
- Declining equities market.
- Upcoming Federal Reserve rate hikes.
- Stagflation concerns.
- Macroeconomic fear & uncertainty.
- Low open interest in the derivatives market.
- Russian and European central bank debt default concerns.
Since Bitcoin is still treated as ‘risk-on’ rather than risk-off, anything that affects traditional finance will also affect Bitcoin. Of vital importance is the risk of Russian and European debt defaults.
The Russian / Ukraine invasion has caused extensive credit ratings downgrades of Russian sovereign and corporate debt issuers. Poor credit raises the cost of borrowing and thereby slows the global economy (which hurts Bitcoin).
Bitcoin logarithmic growth curves (TradingView)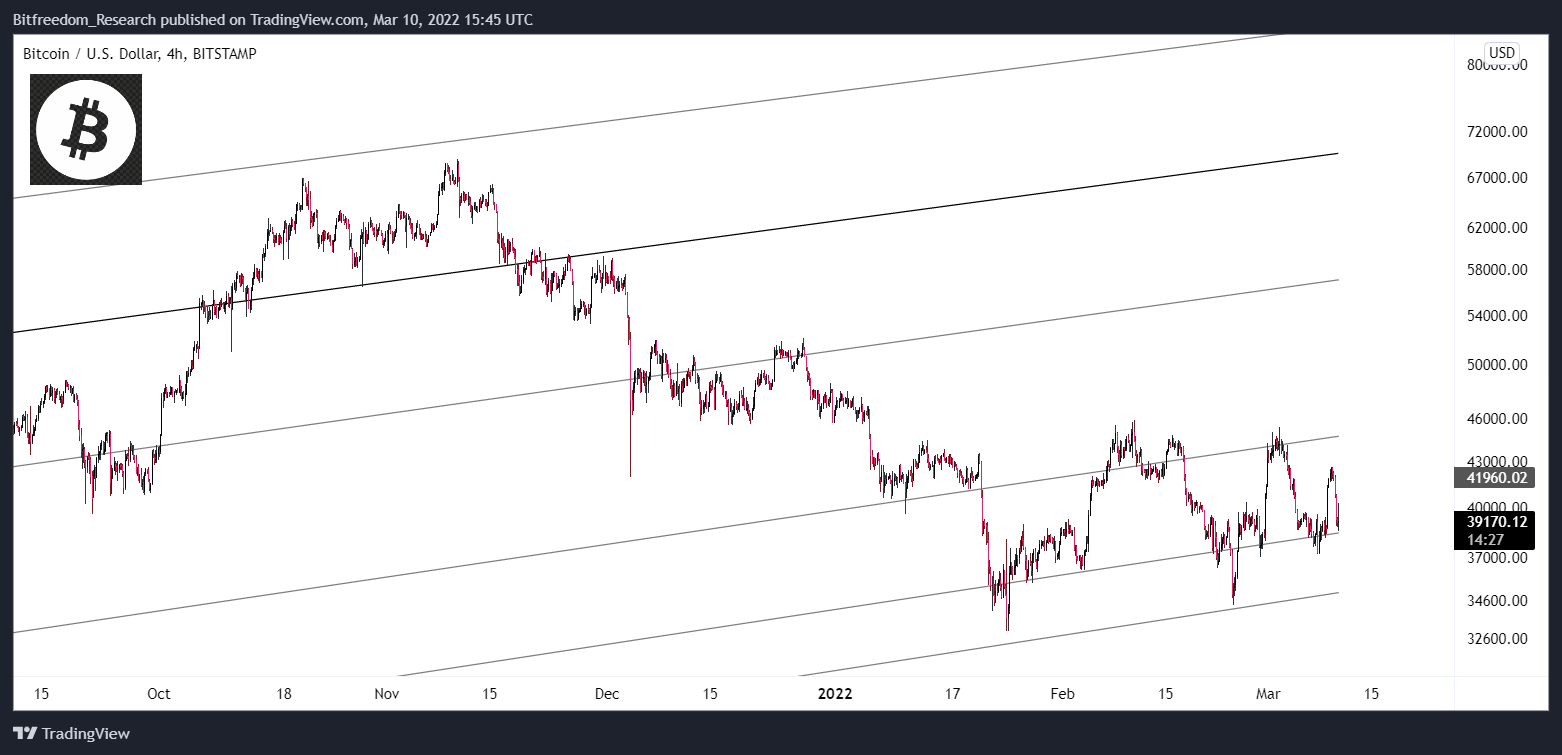
Additionally, by looking at Bitcoin’s derivatives market, we can see declining interest and bearish sentiment leverage traders. As we can see in the chart below, quarterly futures annualized basis continues to fall. This means last year’s hype is now gone, and only long-term investors (typically spot buyers) remain in the crypto market.
Quarterly futures annualized basis (Glassnode)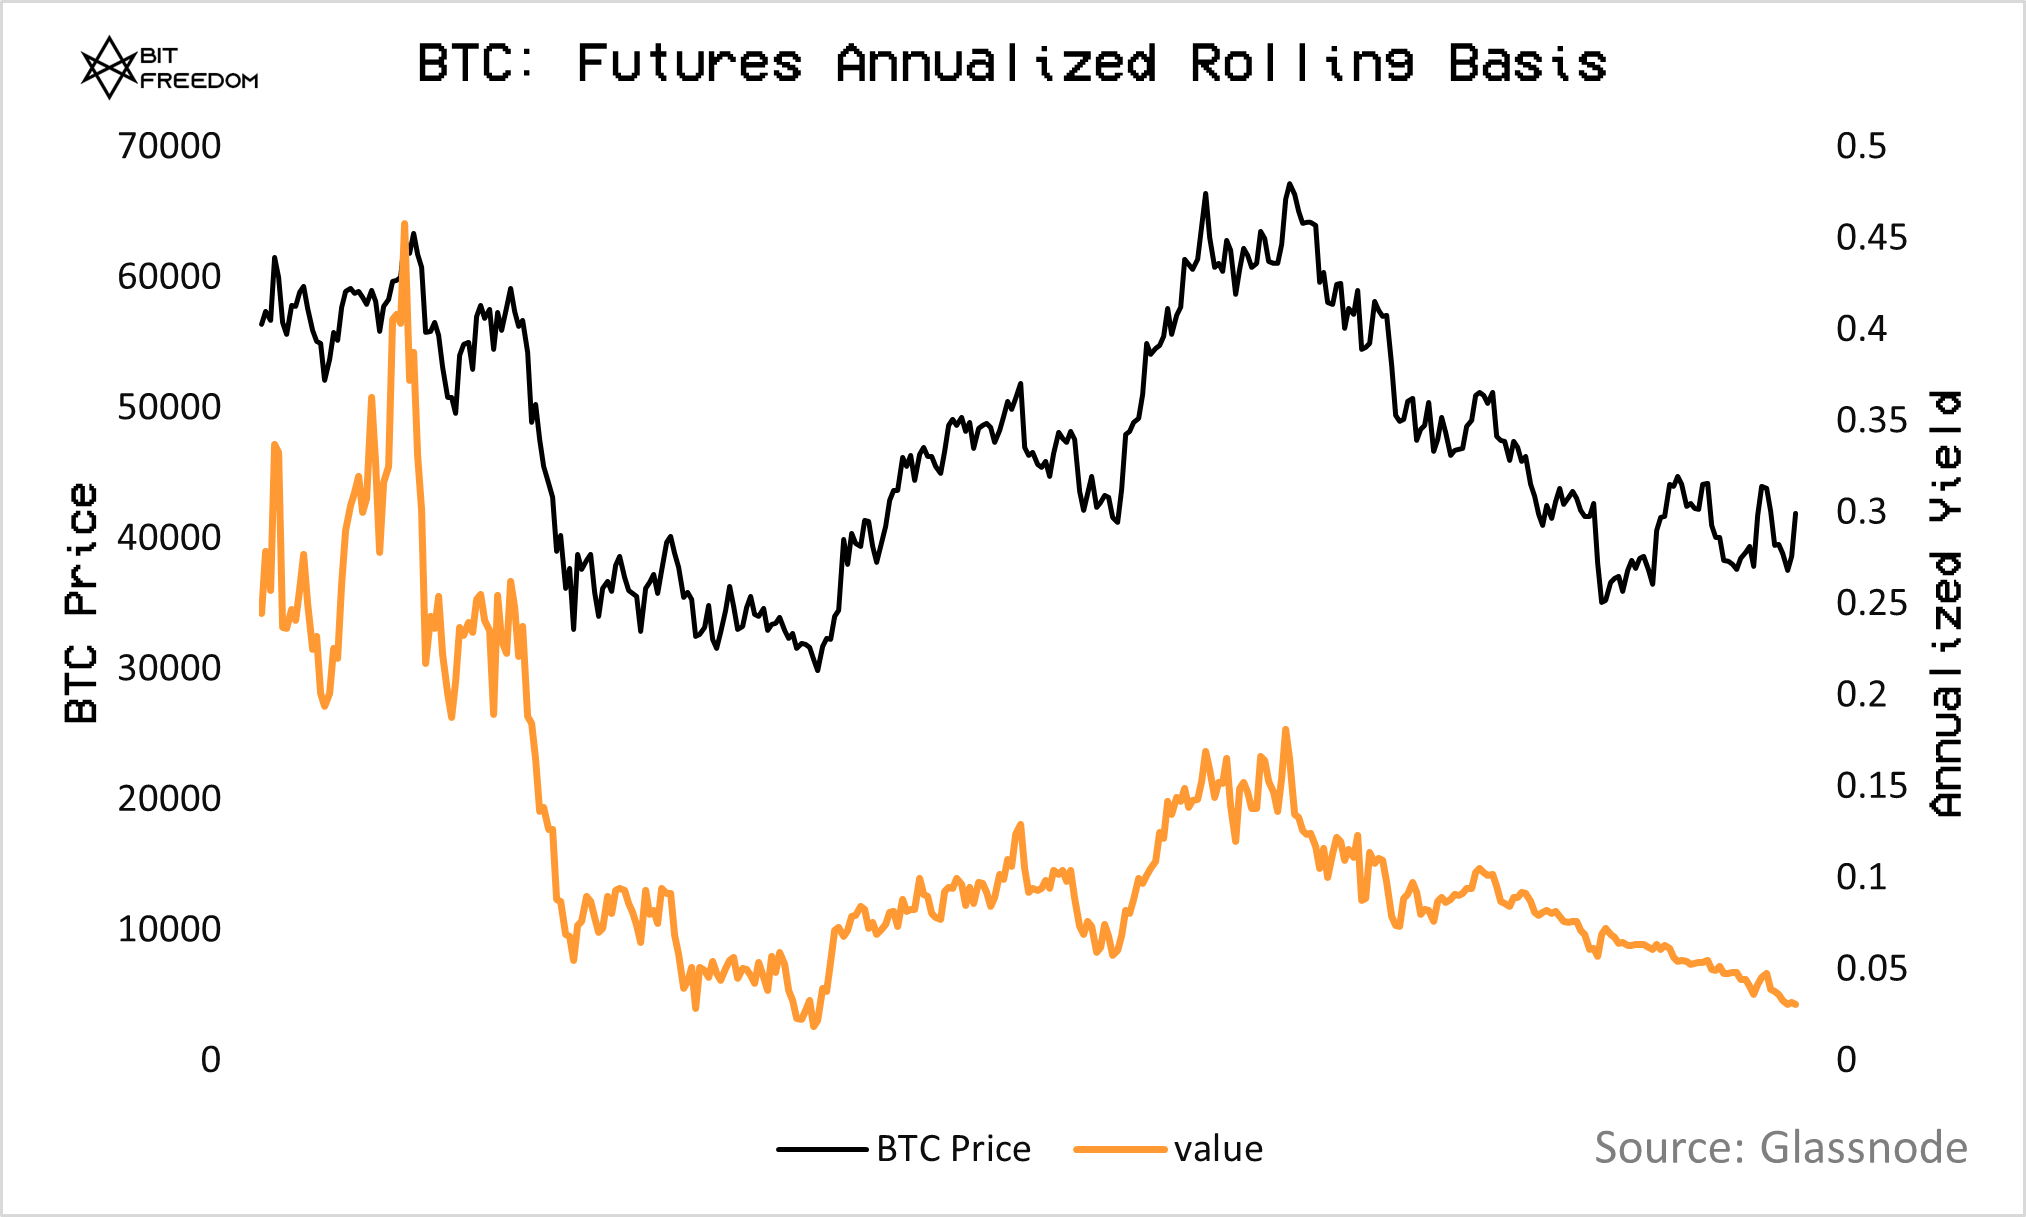
Summary
Judging from past Bitcoin cycles along with current Elliott wave projections, it seems likely that Bitcoin will reach its bottom logarithmic growth curve (currently located at $30K) sometime over the next few months.
Throughout 2022, demand has stepped in every time Bitcoin reached below $35K. However, retail investors are currently feeling the pain of high inflation and flat wages, which affects their ability to invest. Due to this, it’s unclear how long Bitcoin’s $35K support can hold.
In the current market, its best to keep stop-losses tight, don’t FOMO above $40K prices, and look to begin accumulating Bitcoin within the $35K-$38K range.