Bitcoin Weekly Setup – BTC/USD Snaps Back to Support at $40,000
Bitcoin (BTC/USD) Technical Outlook: Neutral
- Bitcoin prices slide after the release of an optimistic NFP report
- BTC/USDthreatens psychological resistance,bulls struggle to gain traction above $40,000
- Risk-off sentiment holds the cryptocurrency market at bay while USD maintains resilience
Visit the DailyFX Educational Center to discover how to trade the impact of politics on global markets
Bitcoin prices have recently remained under pressure as geopolitics and the probability of higher rates weigh on risk sentiment. Although the downward trajectory from the November 2021 high currently remains intact, an increase in the severity of the war between Russia and Ukraine on both the commodity market and the global economy has supported the demand for safe-haven assets, boosting demand for Oil, wheat, Gold and other assets/currencies with safe-haven appeal.
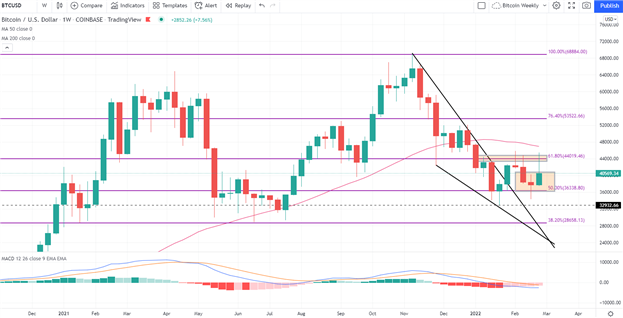
However, while Bitcoin, Ether and alt-coins remain vulnerable to risk aversion and volatility, BTC/USD has managed to stabilize above the key psychological level of $40,000 which will likely continue to provide a firm level of support and resistance for the imminent move. Meanwhile, after bulls failed to break above the $44,000 handle, bears were temporarily able to drive prices back within a zone of confluency, formed by the key Fibonacci levels of historical moves.
Bitcoin (BTC/USD) Technical Analysis
At the time of writing, Bitcoin prices remain between the 50 and 61.8% Fibonacci retracement levels of the 2020 – 2021 move at the respective levels of $36,338 (support) and $44,000. After bouncing off of psychological support at $33,000 last month, bulls were able to drive prices higher before running into a wall of resistance above $44,000.
As buyers and sellers battle it out, a series of long wicked candles on the weekly time-frame is indicative of indecision as prices remain below the 50-period moving average (MA).
Bitcoin Weekly Chart
Chart prepared by Tammy Da Costa using TradingView
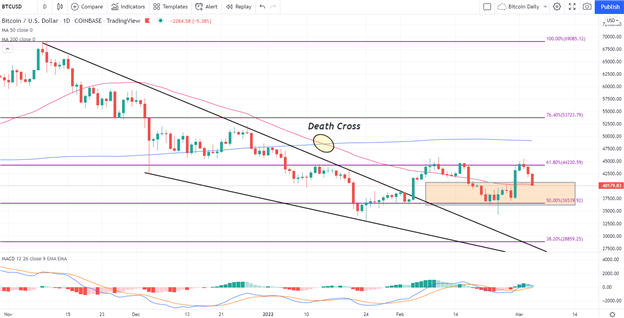
Meanwhile, on the daily time-frame, following the formation of a ‘death cross’, a test of the $36,539 Fibonacci level allowed price action to rise above the 50-day MA (moving average), providing an additional layer of support while the MACD (moving average convergence/divergence) trades along the zero line.
Bitcoin (BTC/USD) Daily Chart
Chart prepared by Tammy Da Costa using TradingView
— Written by Tammy Da Costa, Analyst for DailyFX.com
Contact and follow Tammy on Twitter: @Tams707

