Ethereum Price Prediction: Triangle Will Determine Direction
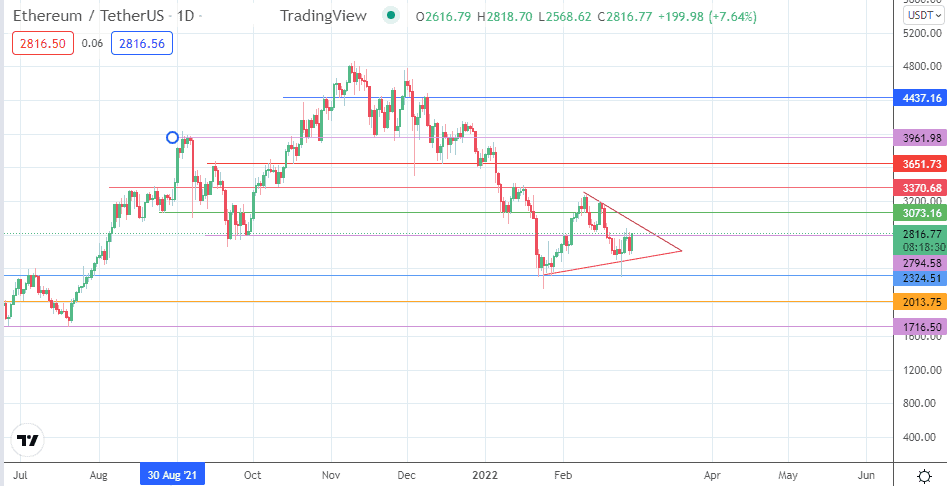
The evolving symmetrical triangle could determine the Ethereum price prediction on the daily chart. Completing the double top of 10 February and 15 February via the downside break of the neckline just above 2794.58 led to the completion of the measured move at 2324.51. A bounce from this support retested the 2794.58 price mark, but this resistance barrier has held firm so far. This barrier now seems to determine whether the bulls or bears will predominate in the battle to establish the direction of the triangle’s resolution.
ETH news today
As the price activity on the ETH/USDT pair trades in a confined range between 2794.58 above and the triangle’s lower border, focus must also shift to the geopolitical situation, which has dominated sentiment on risky assets in the last week or two. Monday brought news that
there would be talks between Russia and Ukraine. A breakthrough that leads to a ceasefire could boost risky sentiment, allowing for bullish Ethereum price predictions. Escalation of the situation could favour more selling and a downside resolution of the pattern.
Ukraine’s vice prime minister Mykhailo Fedorov has called for a ban on all crypto addresses linked to Russians. There has been silence from the exchanges, even as crypto donations to Ukraine top $29m. The situation remains fluid and could dictate how the ETH/USDT price activity plays out.
Ethereum Price Prediction
The daily chart paints an interesting picture. The price activity continues within the context of a large symmetrical triangle, with the price nearly at the triangle’s apex and set for a breakout. The 6.96% upside seen on Monday is challenging the resistance at 2794.58. This resistance needs to break with at least a 3% penetration close to the upside. Extension of this move beyond 3073.16 (27 August/7 September 2021 lows) breaks the triangle to the upside. This move opens the door for sequential targeting of 3370.68 and 3651.73, as the breakout seeks to complete a measured move around the 4437.16 mark.
On the flip side, rejection at 2794.58 opens the door for the bears to breach the triangle to the downside. Attainment of the 2324.51 support achieves this objective. Downside targets await the price activity at 2013.75 and 1716.50 if the triangle’s breakdown seeks a measured move to the south.
ETH/USDT: Daily Chart
Follow Eno on Twitter.