How Bitcoin Is Valued, Similarities To Gold And Fed Policy Implications

hamzaturkkol/iStock via Getty Images
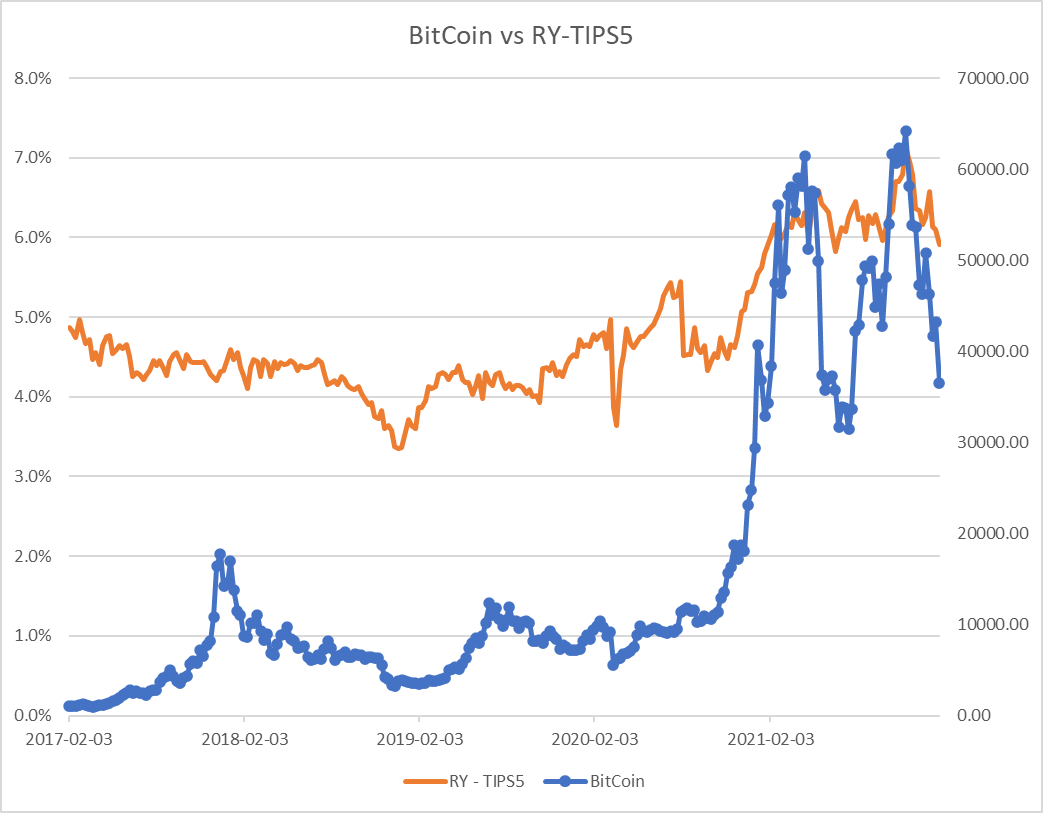
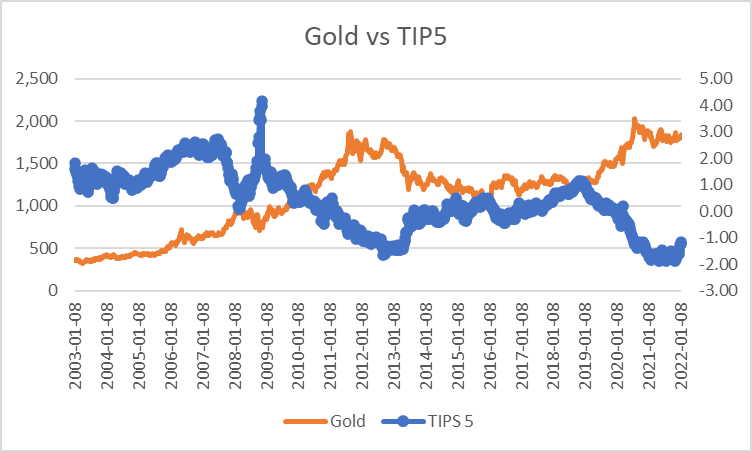
Bitcoin (BTC-USD) is heavily influenced by a combined inflation derivative I call the “Required Yield” or “RY” (explained below) and the TIPS (Treasury Inflation-Protected Security) yield (5-year maturity used here). Thus the yield shown on the left in Chart 1 is an expected inflation derivative – (minus) the TIPS 5-year maturity yield (a negative yield ends up being added).
It quite clear that this relationship has held since 2017, and become more pronounced with both the spike in this combined yield and the value of Bitcoin itself.
While investment flows and commercial use certainly have effects, this is compelling evidence that real yields and expected inflation are major drivers of Bitcoin (blue in the chart below), and as we shall see, gold valuation.
Chart 1:
Author
How The Real Yield Gets Unreal And Inflation Spikes Thanks To The Fed
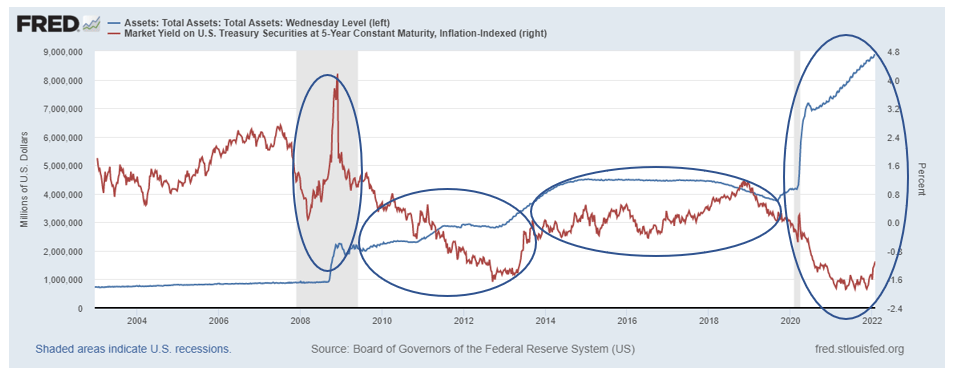
Chart 2: 5-Year TIPS yield vs. Fed Assets:
St Louis FEd
There is a clear inverse correlation between the change in Fed assets and the TIPS yield (real yield) in the three left-most circled periods. After a brief yield spike during the initial phases of the 2008 Financial Crisis, when expected inflation turned massively negative, and as the Fed bought trillions of impaired financial assets, the TIPS yield began a collapse into negative territory as the Fed increased its asset holdings (by buying distressed loans with created money going into capital markets which otherwise would have seen trillions in capital destruction).
As asset holdings leveled off and began to fall as a ratio to real GDP, the real yield began to recover until the government and Fed’s actions in response to the Covid crisis which resulted in many more trillions of created money pumped into the economy – but this time mainly to consumers; and thus in spendable form.
The behavior of the real yield represents the effect of the creation of capital in excess of real GDP, which, in sufficient magnitude, cannot earn a positive real return.
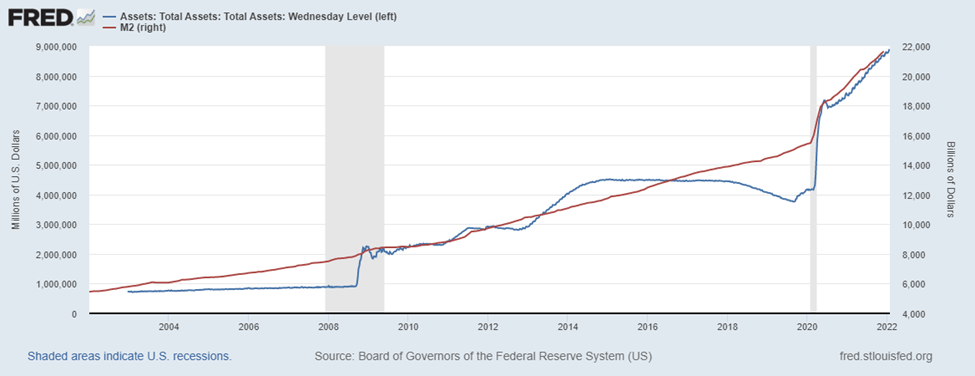
Chart 3: Fed Assets and Money Supply
St Louis Fed
The difference in impact to M2 between the monetization (buying) of impaired assets by the Fed during the 2008 Financial Crisis and the direct injection of money into consumers’ hands during the on-going Covid Crisis is very evident by looking at the latter and larger Fed assets jump accompanied by the spike in M2 since 2019; which was not seen during the Financial Crisis; and why inflation was seemingly not impacted during the Financial Crisis (in fact, it was, because the Fed prevented deflation which market forces would have correctly driven). Simply put, newly created money went directly into spendable form: M2.
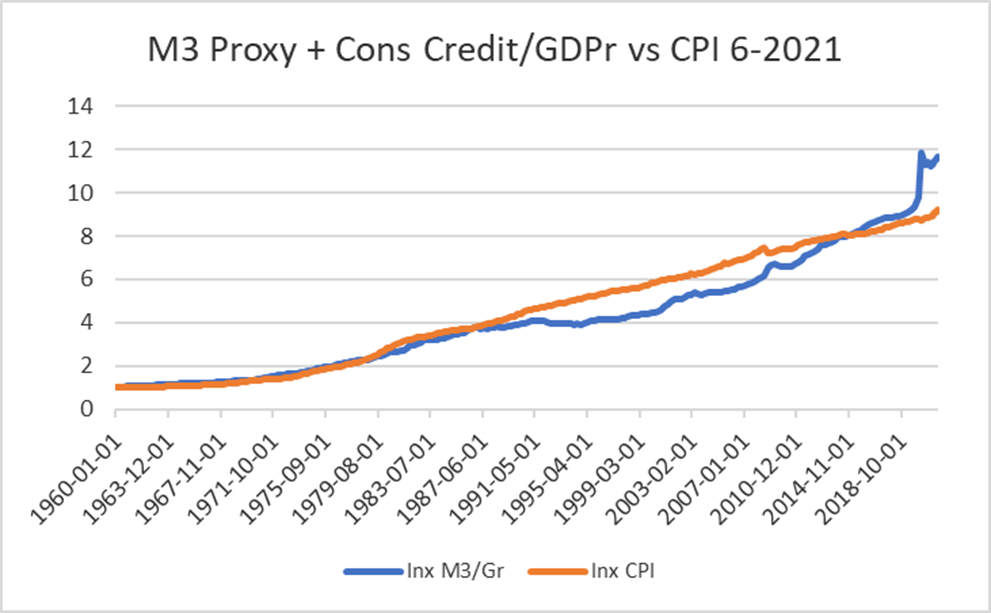
Chart 4 shows the St. Louis Fed’s M3 proxy + consumer credit (behaves similarly to M2) as a ratio to real GDP vs the CPI; both indexed to 1 in 1960. This demonstrates that inflation is mainly and sustainably a monetary phenomenon and is always caused by government Treasury and Fed policy.
Author
As recently as mid-January ‘22, M2 rose month over month by over 1%; implying an over 12% annual rate; which if maintained in the face of even 4-5% real GDP growth (very unlikely); would drive 7-8% inflation.
Implications for Bitcoin and Gold
Bitcoin
If the Fed follows through with its policy of reducing its balance sheet, and the government does not again require the Treasury to pump money into consumers’ hands, then the TIPS yield will move into positive territory; price falling dramatically; nominal bond yields will rise driven by the rising real yield; prices also falling sharply. (Chart 2) The nominal yield rise is currently driven entirely by the rising real yield, since inflation expectations have remained relatively constant (nominal 5-year Treasury – the TIP5 yield).
Bitcoin shares a key attribute with gold: limited supply (finite in the case of Bitcoin; supply increasing at the rate of population growth in the case of gold). These characteristics mean that real GDP growth is generally greater than the supply growth of both Bitcoin and gold; unlike fiat money where supply growth exceeds real GDP growth. Inherently, per unit of Bitcoin and gold, real GDP increases; which can be thought of as an inherent real yield. Holding fiat money is a negative real yield equal to the inflation rate.
Introducing an expected inflation derivative that I’ll call the “Required Yield” (RY), which is the after-tax and after expected inflation yield that returns a constant equal to expected long-term per capita real GDP growth.
RY = [(expected inflation rate (nominal 5 year Treasury – TIPS 5 or St. Louis Fed expected inflation series) + long term expected real per capita productivity growth (2% before mid 2020 and 1% since)/(1 – effective personal tax rate)]. Example: (2.7% expected inflation + 1% – (-1.16)% TIPS 5 yield)/(1-.2) = 6.1%…where the .2 is a 20% effective tax rate on long-term investment holdings.
Mapping this yield vs Bitcoin price is shown in Chart 1.
Gold
Gold faces the same two headwinds: the prospect of higher real TIPS yield (higher real return on money and bonds) and potentially lower expected inflation.
Chart 5 shows the well-known inverse recent relationship between the TIPS yield and gold prices, a trend which began during and after the 2008 Financial Crisis, but did not hold before.
Author
Chart 6 shows gold vs RY- TIPS 5 yield.
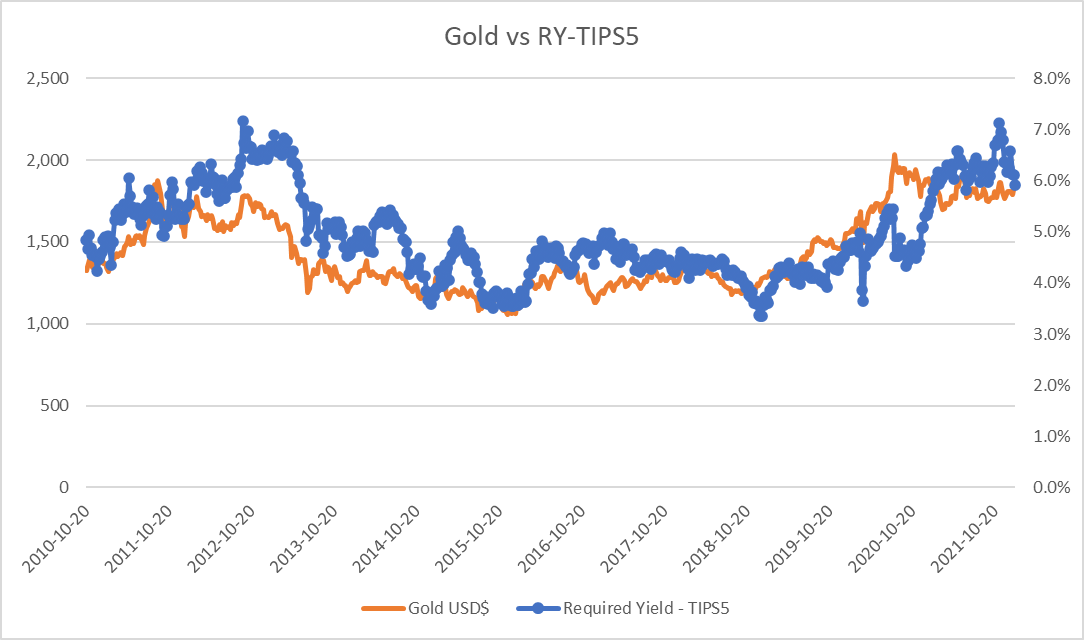
Author
This shows that gold varies inversely with both the expected inflation rate and to changes in the real yield which depart from long-term real per capita productivity growth. Since the real yield is subtracted from the inflation-based required yield in the first formula, a negative real yield adds to the resulting combined yield.
A much fuller analysis and derivation of the valuation of gold across 200 years of gold and fiat monetary standards can be found in my Journal of Investing paper.
Summary
Bitcoin and gold both vary inversely with the real yield and expected inflation and their price changes can be predicted based on these expectations. Both face the same announced Fed policy headwinds.
The reason for this is that both earn an inherent real yield which is valued higher when either the yield on money falls via inflation, or the real yield on financial assets falls since their inherent real yield is not affected. The reverse is true when inflation expectations fall and/or the real yield rises.