Bitcoin (BTC) Rallies 13% Since Rebounding from Local Lows

Bitcoin (BTC) has been increasing since reaching a local low of $33,000 on Jan 24. It’s now approaching the first significant Fib and horizontal resistance area.
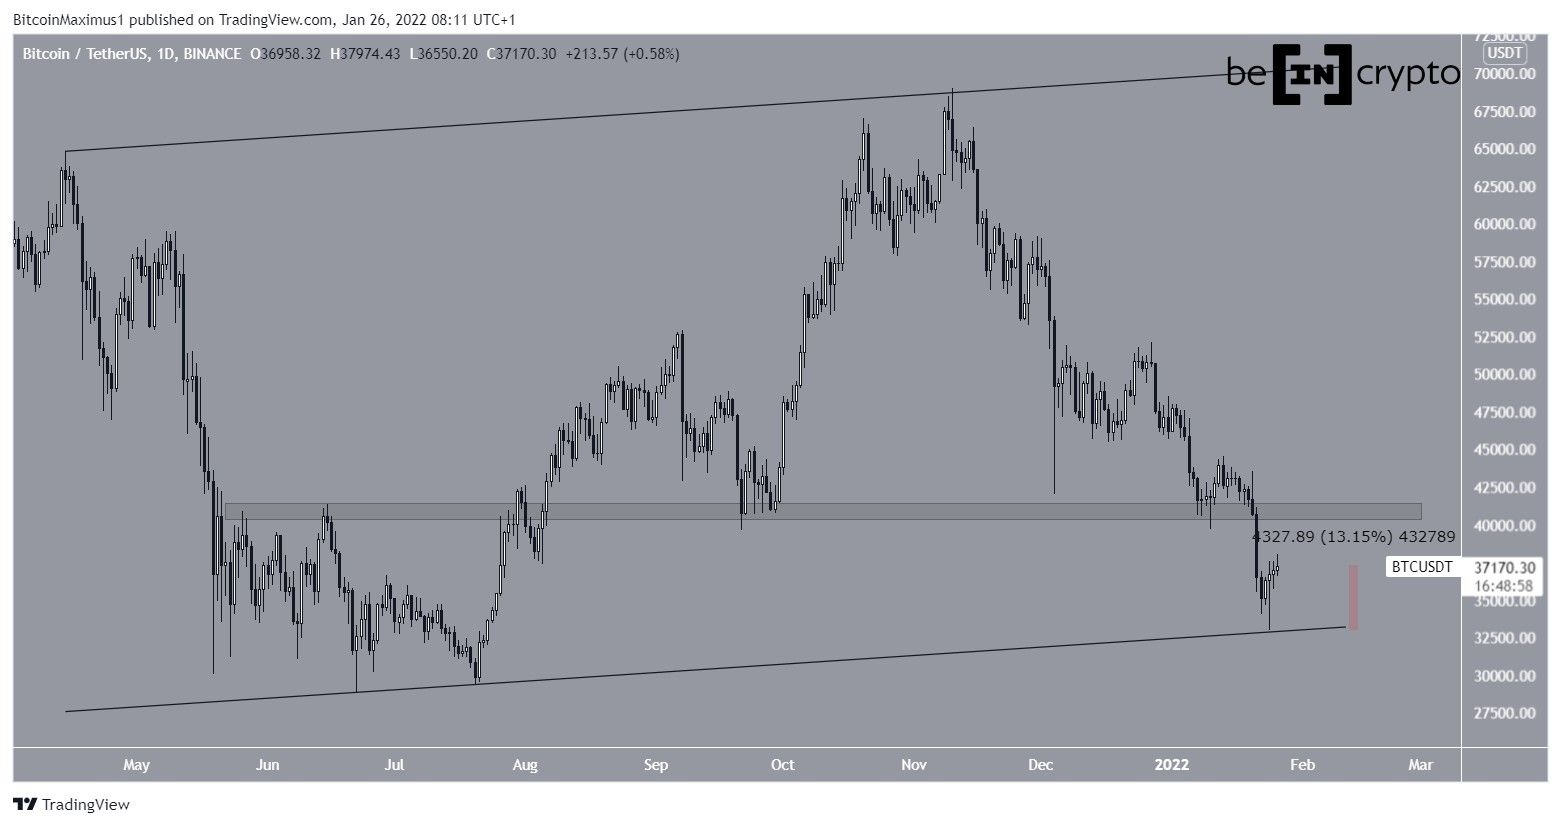
Bitcoin has been trading inside an ascending parallel channel since April 2021. On Jan 24, 2022, it reached a low of $32,917 and rebounded. This served to validate the support line of the channel and BTC has increased by 13% since.
The main resistance area is found at $40,800. This is an area that previously acted as support until BTC broke down below it on Jan 21. Therefore, the area is now expected to provide resistance.
Ongoing BTC bounce
The two-hour chart shows that BTC is approaching resistance at $38,200. This is both the 0.5 Fib retracement resistance level and a horizontal resistance area. A breakout above it would be a crucial development in creating a bullish structure.
Technical indicators are also showing bullish signals. The RSI, which is a momentum indicator, has already moved above 50 (green icon) suggesting that the short-term trend is bullish. Similarly, the MACD is nearly positive
However, it remains to be seen if this move above 50 (red circle) will only be a short-term deviation, similar to what happened on Jan 20.
A breakout and close above $38,200 would go a long way in confirming that the increase is not just a relief rally.
Short-term movement
The 15-minute chart shows that BTC is attempting to move above the $37,400 area, which previously rejected it twice (red icons).
However, it’s trading inside an ascending parallel channel, which is usually a corrective pattern. The movement inside the channel also has very frequent overlaps, further supporting the possibility that it’s corrective.
Because of these signals, an eventual breakout from the channel seems to be the most likely scenario, prior to the continuation of the downward movement.
Despite this potential short-term drop, the most likely long-term count still suggests that a bottom has been reached.
For BeInCrypto’s previous Bitcoin (BTC) analysis, click here!
Disclaimer
All the information contained on our website is published in good faith and for general information purposes only. Any action the reader takes upon the information found on our website is strictly at their own risk.