Bitcoin: Halving Cycle Resumes, Backed By Fundamental Catalysts (BTC-USD)
Beautifulblossom/iStock Editorial via Getty Images
The Bitcoin Halving Narration and The Potential Resumption of Bitcoin’s Bear Market
Our previous coverage presented 2 critical points of consideration for why a Bitcoin (BTC-USD) bull run should’ve ended by May 2021. The first point of consideration is the critical resistance level that Bitcoin failed to break out over the past 10 years. Notice that Bitcoin’s recent drawdown began as soon as Bitcoin bounced off the 10-year resistance level in Figure 1.
The second point of consideration is the 3 phases of a Bitcoin halving cycle. The Bitcoin halving cycle comprises a 1-year bull market, followed by a 1-year bear market and a 2-year recovery period. These 3 phases are depicted in Figure 1. If we examine the Bitcoin bear market closer, we can also observe 5 clear sequences of events that Bitcoin follows before bottoming out and transiting to the recovery period.
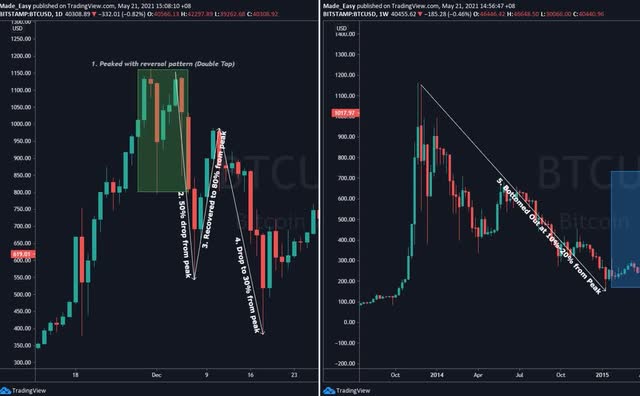
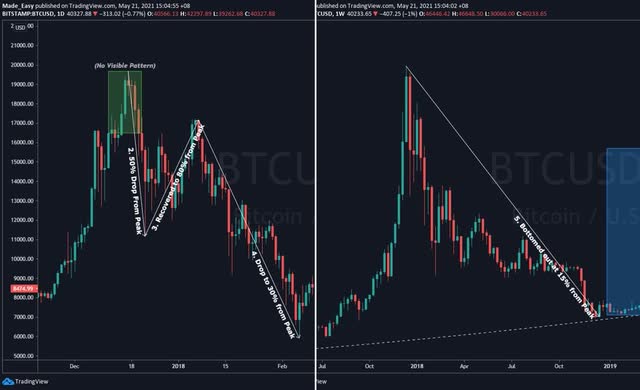
Bitcoin’s past 2 bear markets (Figure 2 and Figure 3) showed that the 5 sequences of events over the 1-year bear market are as follows:
- Reversal pattern
- 50% decline from peak
- Rebound back to 20% from peak
- Another decline to 70% from peak
- Bottom out at 85% from peak
Figure 1: Critical Support Resistance Guiding Bitcoin’s Cycle. Author, TradingView Figure 2: 5 sequences of events during Bitcoin’s 2014 bear market Author, TradingView Figure 3: 5 sequences of events during Bitcoin’s 2018 bear market Author, TradingView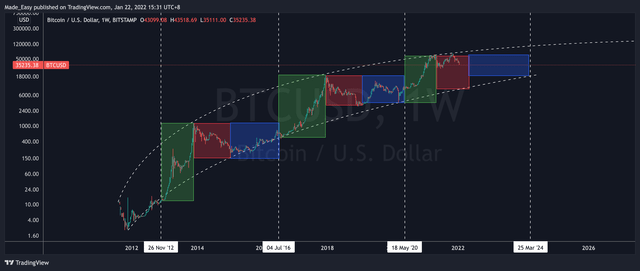
Therefore, Bitcoin is supposed to be in a bear market since May 2021 based on its halving cycle. Referring to Figure 4, we can observe that Bitcoin followed through the first 3 of 5 sequences of events. Firstly, Bitcoin flashed a reversal distribution pattern (Head & Shoulders or Wyckoff Distribution Pattern), followed by a 50% decline before rebounding back to 20% away from the April peak. By then, Bitcoin was supposed to continue its 4th sequence of events to decline 70% from the April peak or to $20,000. However, this sequence of events was temporarily disrupted by the sudden launch of the NYSE Bitcoin Futures ETF (NYSEARCA:BITO), which saw Bitcoin hitting a new all-time high.
Figure 4: Sequences of Bitcoin’s Bear Market Before A Sudden Disruption Author, TradingView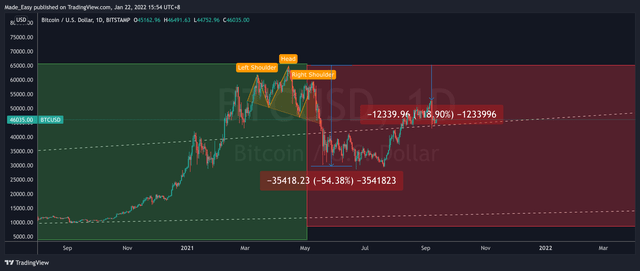
However, this temporal bullishness wasn’t enough for Bitcoin to break its 10-year old resistance in Figure 1. After 5 weeks of struggle, Bitcoin quickly resumed its bearish movement by falling 50% in 9 weeks. To make things worse, a massive Head & Shoulders pattern is currently printed on the Bitcoin weekly chart (Figure 4.2). Based on the distance between the Head and the Neckline, the bearish pattern suggests Bitcoin can quickly decline to the $15,000 price level.
Figure 4.1 Massive Head & Shoulders Pattern on Bitcoin Weekly Chart Author, TradingView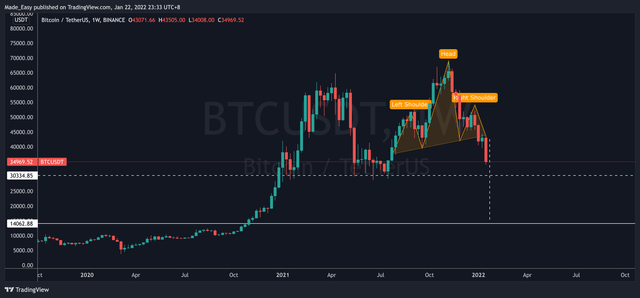
There is also evidence suggesting Bitcoin’s current decline isn’t triggered by mere technical catalysts but also fundamental catalysts. Hence, we have reasons to believe that Bitcoin’s halving cycle remains intact despite much higher institutional participation than the past 2 cycles.
Fundamental Catalysts of Bitcoin’s Bear Market
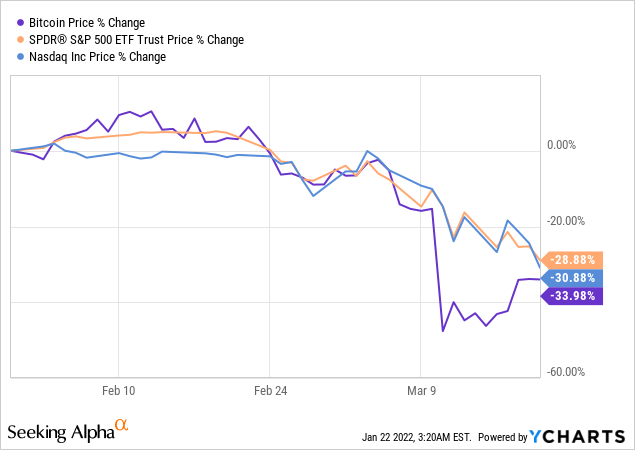
Simply put, Bitcoin’s current meltdown is the result of the stock market meltdown. This event very much correlates to Bitcoin’s meltdown in March 2020 due to the stock market meltdown amid the start of the COVID pandemic in March 2020 (Figure 5).
Figure 5: Bitcoin’s meltdown alongside the stock market in 2020
Then why is the stock market falling? The 3 catalysts are inflation, the Fed’s tapering, and interest rate hike.
Inflation fears were the cause of the first wave of the stock market selloff in February 2021. Despite the Fed’s constant assertion that inflation is transitory, inflation was constantly rising before hitting 10% in November. In December 2021, the Fed finally responded that inflation might not be transitory after all before guiding 8 interest rate hikes over the next 2 years and plans to pick up tapering efforts in the immediate future. It is not until the Fed unexpectedly announced (a month later) that even tighter policies may be required to control inflation.
Finally, a strong labor market was reported in January 2022, which supports the narrative of much tighter policies for 2022. Do not underestimate this statistic because the Fed explicitly stated that tapering and interest rate hikes would be considered only after making significant progress toward full employment.
This series of events led to the current cascade of stock market selloffs, which also spilled over to the crypto market.
Figure 6: Federal Reserve Interest Rate Projection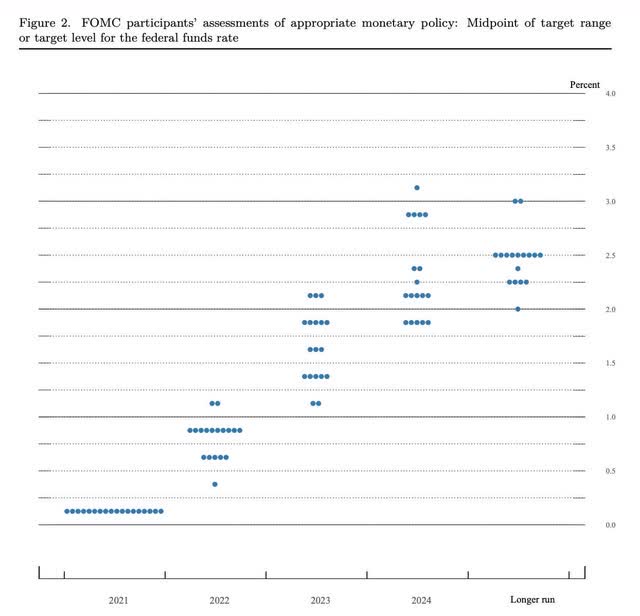
Caution Against Holding Bitcoin Mining Companies
No one knows how these events will unfold unless one has the power to influence. But if Bitcoin’s halving cycle were to play out completely, we would see a $10,000 Bitcoin. Even if one sees only a 5% chance of this event ever occurring, we should be prepared as this event occurred 100% of the time during Bitcoin’s past 2 halving cycles.
Bitcoin miners face additional risk on top of the risk of a prolonged bear market.
Firstly, Bitcoin miners might risk insolvency. We’ve covered several high-profile Bitcoin miners such as Riot Blockchain (RIOT), Bitfarms (BITF), Stronghold Digital Mining (SDIG), Core Scientific (CORZ), and Hut 8 Mining (HUT). The 4-figure mining costs that these Bitcoin mining companies report only include electricity and hosting costs. Hence, if one only examines these reported mining costs, one might have a false impression that these mining companies can survive a prolonged Bitcoin bear market down to $10,000.
However, when we include other business costs, we found that the total all-in costs of a mining company are in the range of $25,000 to close to $40,000 per Bitcoin. At the time of writing, Bitcoin is already trading at $36,000 per BTC. This means that RIOT will be unable to cover its business costs now.
On the other hand, HUT prides itself on having a balance sheet-first mindset towards its mining operations, meaning it prioritizes growing its Bitcoin holdings as fast as possible and as much as possible. In Q3 2021, Hut managed to grow its Bitcoin by 302 BTC per month, compared to 220 BTC (28% less) and 115.25 BTC (62% less) per month for BITF and RIOT, respectively. Regardless of how well HUT has executed its balance sheet-first strategies, HUT is expected to lose its ability to accumulate Bitcoin meaningfully should Bitcoin trade below its $27,000 per BTC total all-in Bitcoin mining cost.
Under this premise, it may be better to hold the underlying asset/commodity (Bitcoin) as investors will not risk insolvency.
Another risk investors face when investing in mining companies is the volatility of a miner’s share price against the Bitcoin price volatility. For instance, RIOT’s share price moves 1.6% for every 1% move in Bitcoin in the same direction. Hence, miners are fundamentally and technically more risky in a prolonged Bitcoin bear market than Bitcoin.
Our Action Plan and Rationale
Although Bitcoin’s halving cycle suggests that Bitcoin is in a bear market in the immediate short term, it also suggests that Bitcoin will be able to rise to at least $100,000 in the next bull run. Since the US Dollar is not backed by any asset but the trust in the US government and can also be manipulated against the interest of stakeholders, Bitcoin can serve as insurance against the USD. We presented our thesis in our previous coverage.
Furthermore, guidance from top officials signals bullishness for cryptocurrencies in general. Firstly, top officials assured stakeholders that the US federal entities aim to maintain investor and consumer protection standards, anti-money laundering rules, and tax laws rather than outlawing digital assets. Secondly, the Federal Deposit Insurance Corporation (FDIC) is reportedly considering expanding its services to cover stablecoins. This is very bullish for cryptocurrencies in general because stablecoins such as the USDC-USD (USDC-USD) are a gateway for more investors to access cryptocurrencies.
We’re bullish on Bitcoin for the long term for all the reasons stated above. Since we do not short fundamentally undervalued assets, we utilize the key support areas identified by the Bitcoin halving cycle to dollar cost average our way down into the bear market.
By referring to Figure 7, our first point of entry will be the $28,500 to $30,000 support zone. This level coincides with the price range in which Tesla (TSLA) and other institutional investors bought Bitcoin. It also coincides with the 50% decline dictated by the 2nd sequence of events in a Bitcoin bear market.
Our second point of entry will be the $20,000 price level. This level coincides with the peak from Bitcoin’s bull market in 2017. It also coincides with the 70% decline dictated by the 4th sequence of events in a Bitcoin bear market.
Last but not least, our third point of entry will be the $10,000 price level. This is perhaps the strongest support than the previous 2 support levels. It coincides with the resistance Bitcoin broke out from during the start of the 2020 bull market. It coincides with the 85% drawdown from the $66,000 peak, which Bitcoin bottomed out 100% of the time during its past 2 halving cycles. It also coincides with the 10-year support.
Figure 7: Entry levels to dollar cost average into Bitcoin Author, TradingView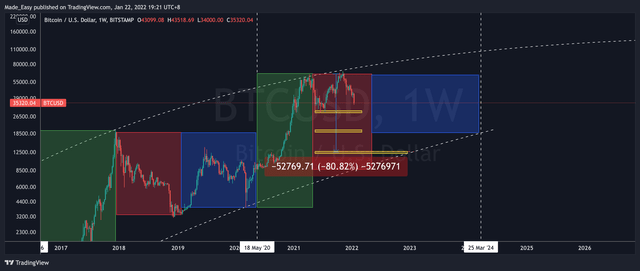
Conclusion
We drew references from Bitcoin’s halving cycle to help us navigate the crypto market. In summary, Bitcoin’s halving cycle suggests that Bitcoin has been in a bear market all along. The bear market was just temporarily disrupted by the sudden bullishness from the NYSE Bitcoin futures ETF launch. The stock market meltdown served as a catalyst to push Bitcoin back into the bear market.
On the other hand, the same halving cycle also suggests that Bitcoin is bullish in the long run. Conservatively, Bitcoin is expected to hit at least $100,000 in the next bull run in 2024, which is only 2 years from now. We’ve also found fundamental evidence to support this technical observation. Therefore, we’ll take this opportunity to scale our Bitcoin holdings. Specifically we’ll be dollar-cost-averaging at $30,000, $20,000 and $10,000 respectively.


