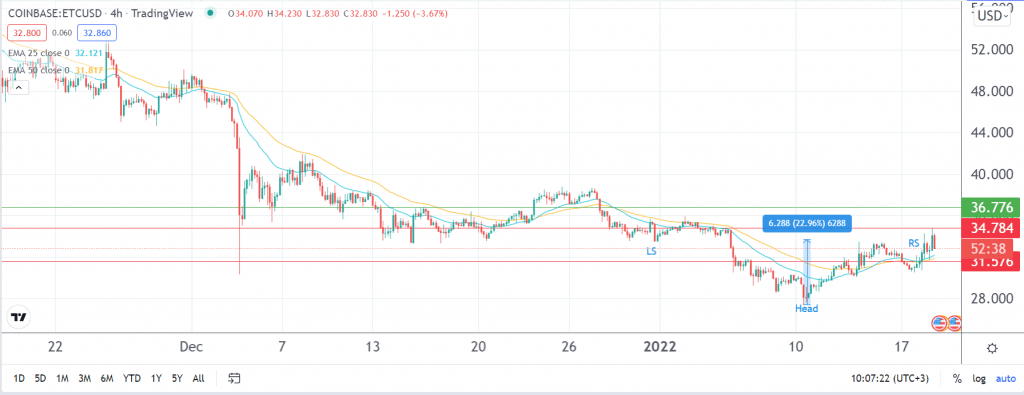
Bullish Pattern Hints at a Probable Rally
ETC price has been holding steady above the psychological level of $30 for a week now after dropping below it in the past week. Interestingly, the altcoin is on a different trajectory from its predecessor – Ethereum. The latter entity is just 4.55% above where it was at the beginning of last week.
ETC Price Prediction
After hitting a nine-month low of 27.38 at the beginning of the past week, Ethereum Classic has rebounded by close to 20%. Granted, the bears have remained in control as it continues to trade below the psychologically crucial level of 50.00. Indeed, that zone has been evasive to the bulls since the start of December 2021.
As at 0626 GMT, ETC price was at 33.55; up by 2.79%. Earlier in the day, it extended its previous gains to trade at the its recorded level at the start of the year. While it has since pulled back, it appears to be in good shape to rally further to December’s resistance level of 40.
On a daily chart, it is above the 25 and 50-day exponential moving averages. The formation of an inverted head-and-shoulder pattern, which is usually a bullish formation, further signals a probable reversal.
The bulls are keen on a sign that the altcoin and crypto market at large is due for a trend reversal. As such, I am of the opinion that the digital asset has already hit its short term bottom and that it is headed higher.
From this perspective, ETC price will likely continue to find support at 31.57 as it faces resistance along Wednesday’s high at 34.78, which is along the inverted head-and-shoulder’s neckline. A move past the range’s upper border may place the resistance level at 36.77 as the bulls gather enough momentum for further rallying. Nonetheless, the upper target of 50.00 may remain evasive in the short term as the crypto market remains under pressure. This thesis will be invalidated by a move below the week’s low at 30.55.

