SHIB Drops 15% in Two Days as Market Tumbles
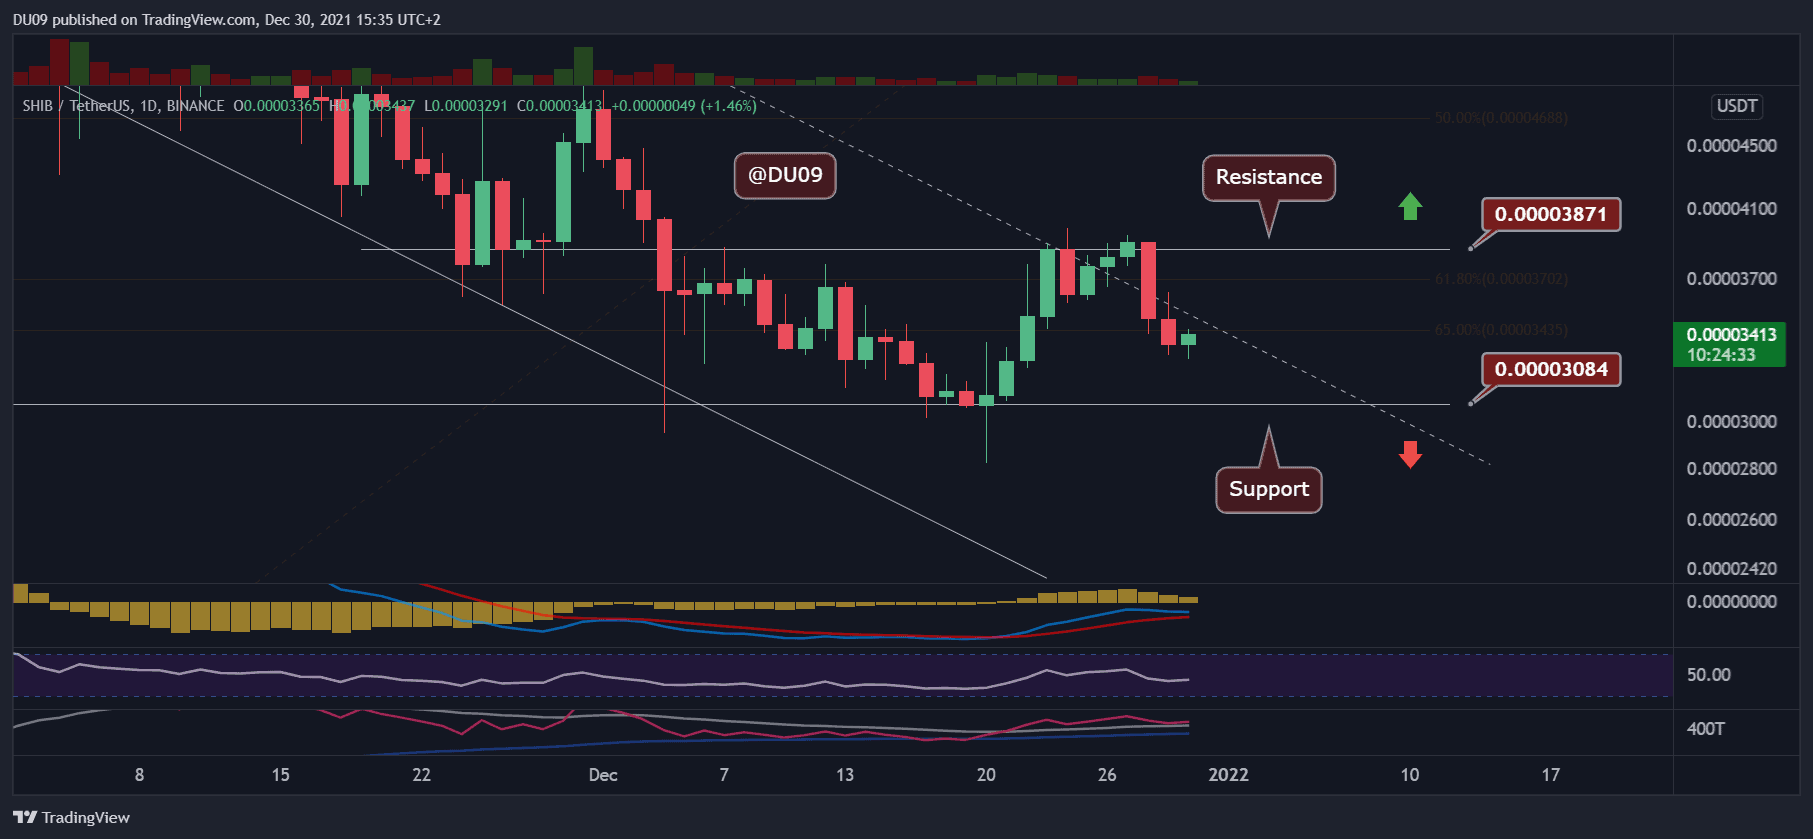
Key Support level: $0.000030
Key Resistance level: : $0.000038
SHIB was rejected by the $0.000038 resistance and pushed lower following the market’s downturn that started on Tuesday. The current support is found at $0.000030 and could be retested if the overall market remains bearish.

Technical Indicators
Trading Volume: The volume has been low despite the current correction. This gives hope that SHIB can quickly reverse course once buyers return.
RSI: The RSI on the daily has stopped falling at the time of this post and if the price manages to do the same then this could be interpreted as a higher low, which is bullish.
MACD: The daily MACD remains bullish. If SHIB can reverse course from this point onwards there is a good chance it can move higher and break the current resistance level.
Bias
The bias on SHIB is neutral. The cryptocurrency appears to be stuck in a flat trend at the time of this post.
Short-Term Prediction for SHIB Price
If SHIB is successful in breaking above the current resistance at $0.000038, then the bias can change to bullish. Until then, the price will remain in a range between support and resistance as it moves sideways.
Binance Free $100 (Exclusive): Use this link to register and receive $100 free and 10% off fees on Binance Futures first month (terms).
PrimeXBT Special Offer: Use this link to register & enter POTATO50 code to get 25% off trading fees.
Disclaimer: Information found on CryptoPotato is those of writers quoted. It does not represent the opinions of CryptoPotato on whether to buy, sell, or hold any investments. You are advised to conduct your own research before making any investment decisions. Use provided information at your own risk. See Disclaimer for more information.
Cryptocurrency charts by TradingView.


