Weekly Close Could Make or Break The Bull Market
The Bitcoin price is straddling maybe the most significant long term market indicator, just as the FOMC will decide its fate.
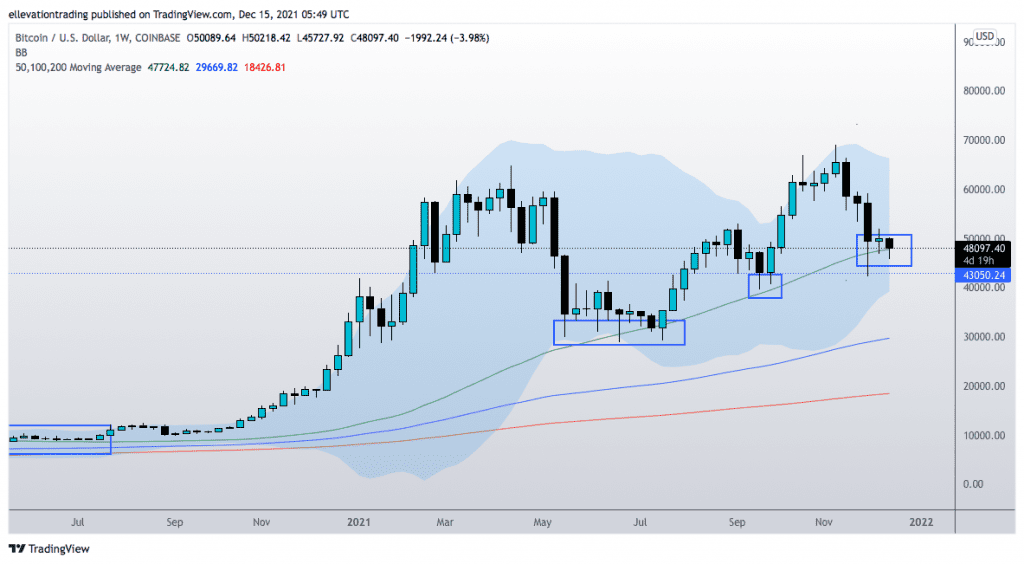
Whilst much of the market is pondering if Bitcoin will hold above the 200-Day Moving Average, it’s the weekly chart that could provide the biggest whether or not BTC will remain in a structural bull market. The 200-Week Moving Average has historically been a significant support level, efficient in gauging BTC’s overall trend. Typically, when the price closes above the 50-WMA, it marks the start of a sustained rally. In contrast, weekly closes below the indicator have mostly preceded bear markets.
Ominously, the current Bitcoin price of $48,100 is just $400 above the 50-WMA at $47,724. Notably, the price has traded below the indicator for two weeks before ending higher. However, tonight the FOMC will announce whether it will accelerate the timeline for reducing bond purchases and provide guidance on interest rates. Whilst I can’t confidently predict which way the Fed will swing, I’m reasonably confident that BTC’s reaction could have long-term implications.
Bur or sell the fact?
Concerns the Fed will roll back asset purchases faster than anticipated is undoubtedly a factor in Bitcoin’s 30% drop from the all-time highs. Subsequently, analysts question whether the market has already priced in the worst-case scenario. In my opinion, they make a valid point, although there are other considerations.
If the Fed is more aggressive than anticipated, it could trigger widespread deleveraging of riskier assets. In that event, institutional holders could unwind long positions to lock in profits ahead of year-end. On the other hand, a dovish surprise could force bears to capitulate and unleash a massive short-covering rally.
Considering the technical backdrop, tonight’s announcement could be the biggest test the Bitcoin price has faced since the China mining ban. Therefore, like many others, I will be keen to see how it plays out.
See also

Bitcoin Price Chart (Weekly)
For more market insights, follow Elliott on Twitter.