Stablecoin Supply Ratio Approaches All-Time Low: Bitcoin (BTC) On-Chain Analysis
In this article, BeInCrypto takes a look at Bitcoin (BTC) on-chain indicators, more specifically the Stablecoin Supply Ratio (SSR) and the (USDT) supply on exchanges. This is done in order to determine how much buying power stablecoins currently have over the entire bitcoin (BTC) supply.
SSR
SSR is an on-chain indicator that is used in order to measure the ratio between the supply of stablecoins and that of BTC. It can move by two changes, which are unrelated to the other:
The lower the value of the indicator, the higher the percentage of the BTC supply can be bought by stablecoins. More specifically, a value of 10 means that 10% of the entire supply of BTC can be bought with stablecoins.
Therefore, if the BTC price moves downwards, the SSR decreases. Conversely, even if the BTC price stays the same, an increase in the stablecoin supply would cause SSR to move downwards.
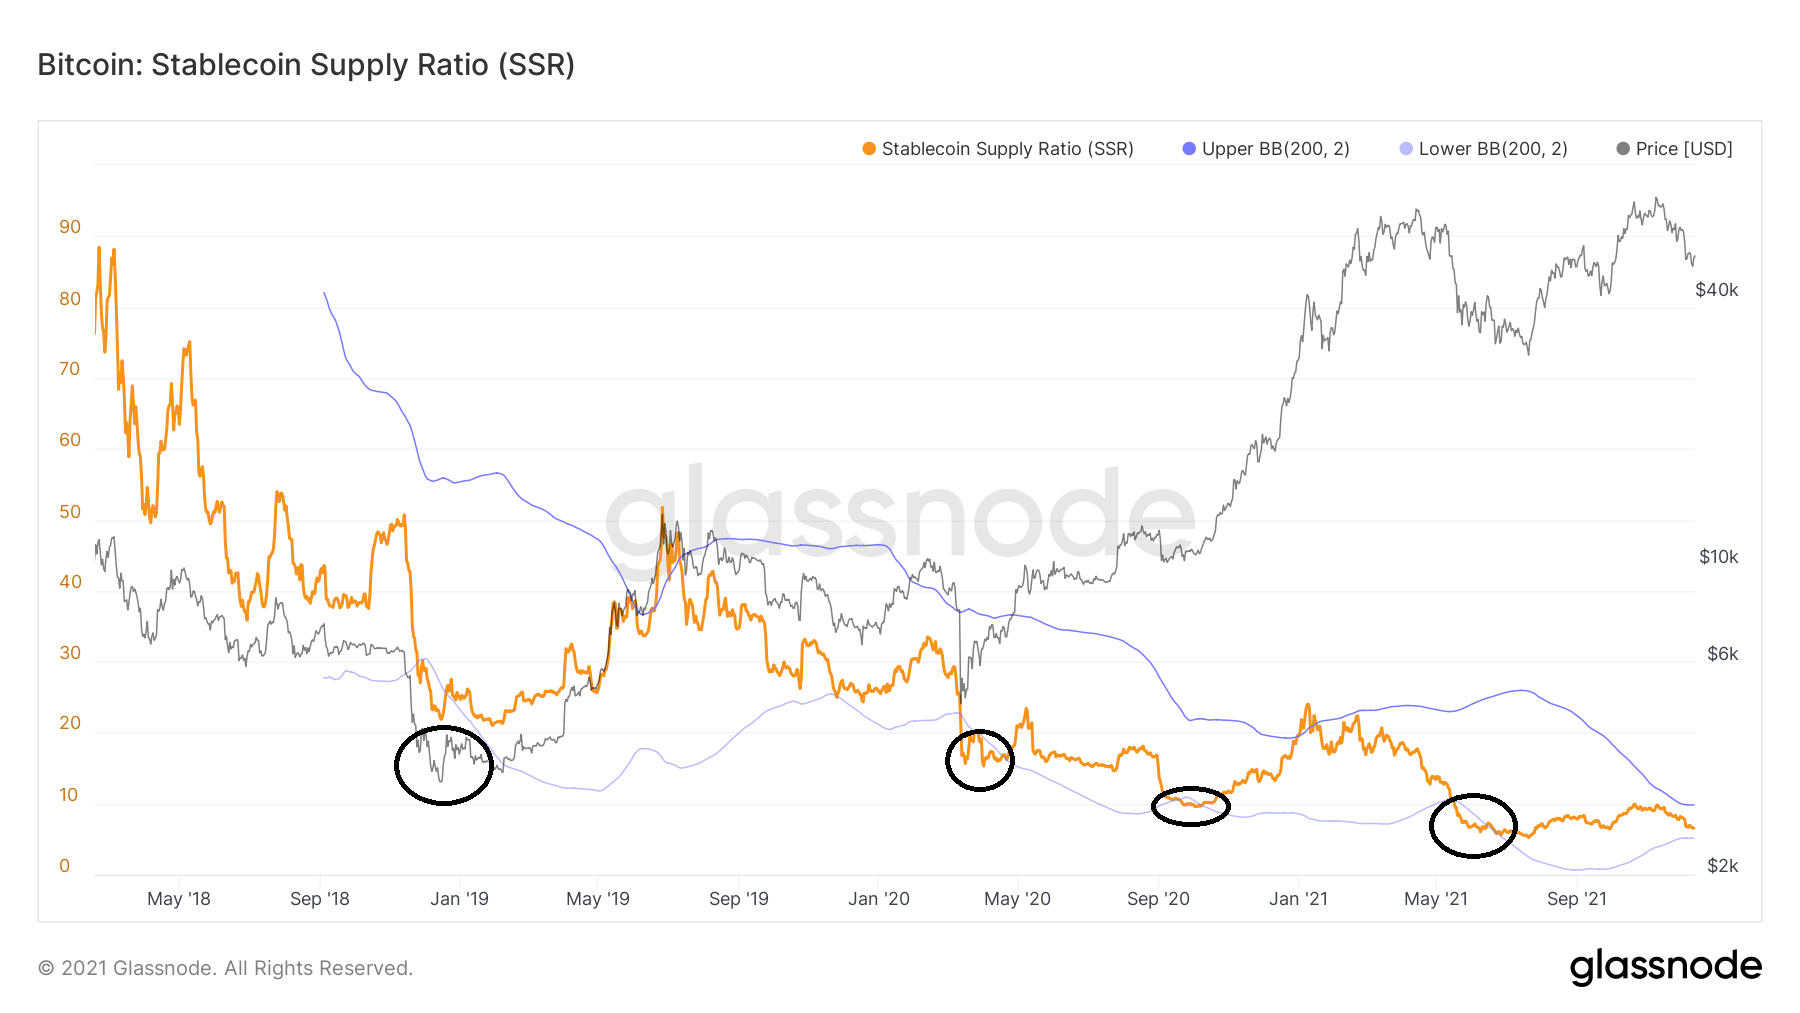
SSR reached an all-time low value of 6 on June 8. This meant that 16.66% (1/6) of the BTC supply could be purchased by the supply of stablecoins.
More importantly, it was the fourth time that SSR fell below the lower Bollinger band (black circle). All three other times this occurred were followed by a significant upward movement in price shortly afterwards.
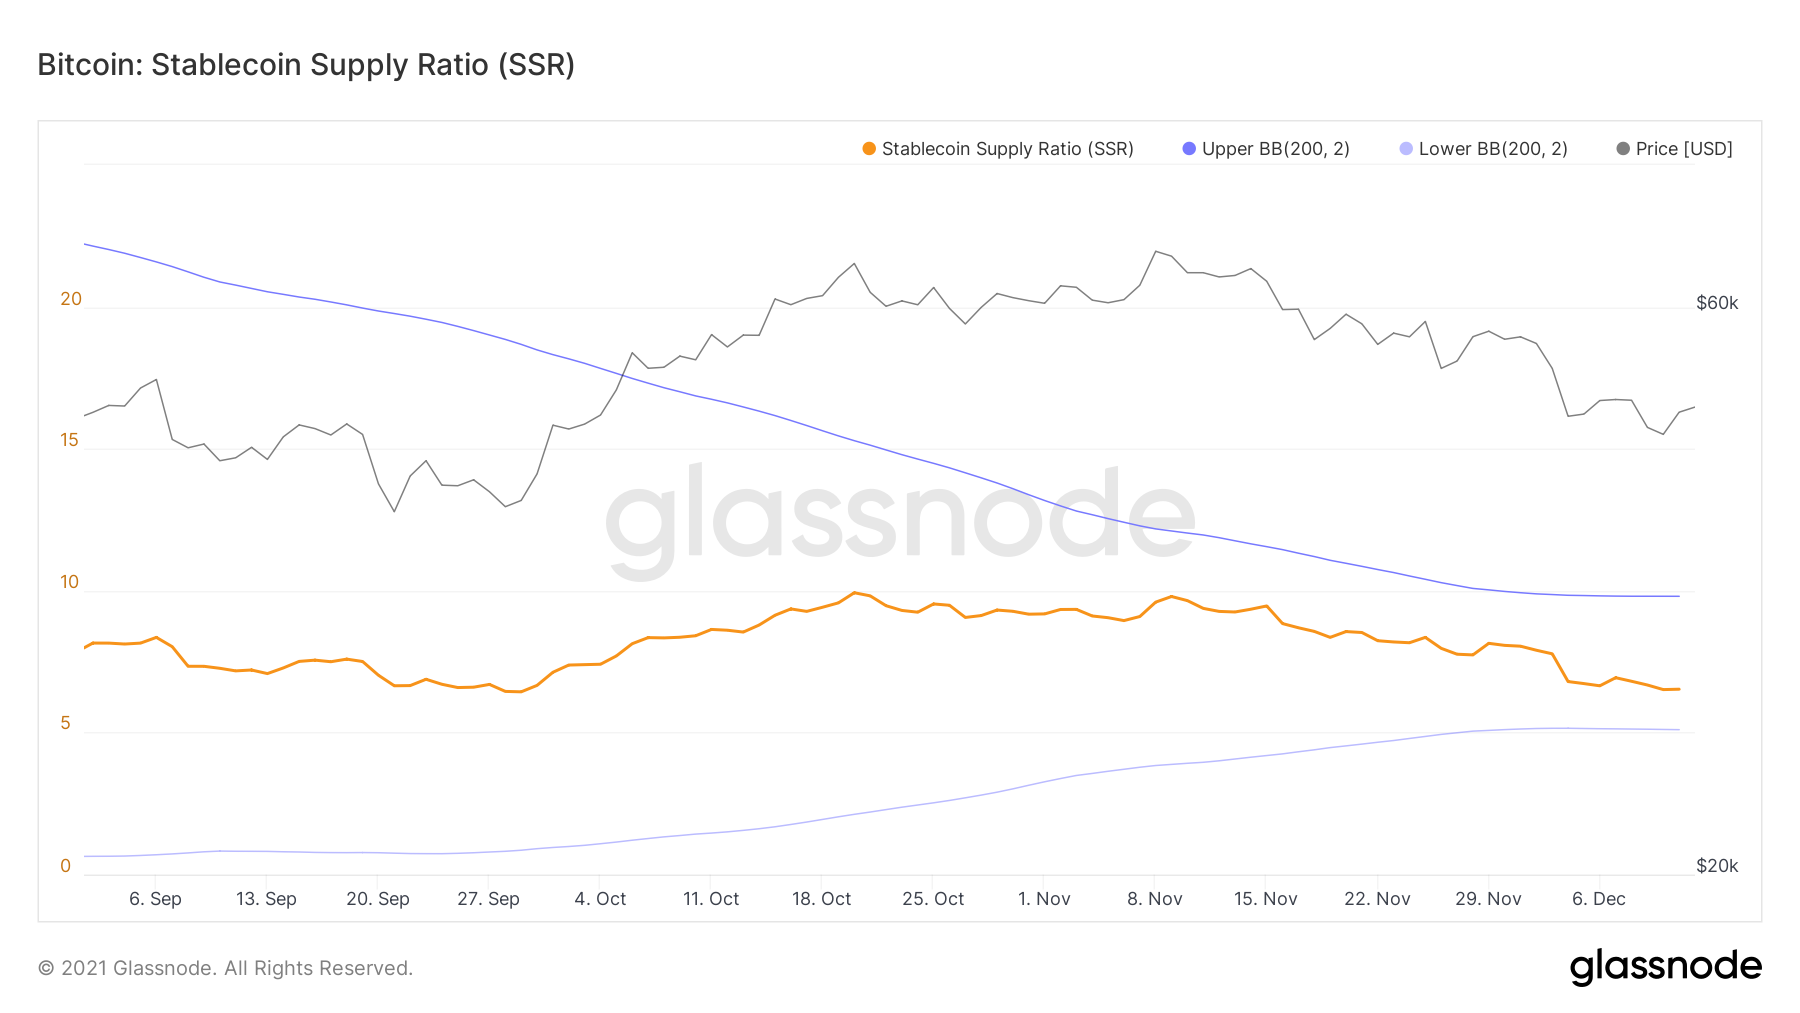
After a bounce, SSR is approaching the June all-time lows once more, currently being at 6.52.

Since the beginning of Sept, the Bollinger bands have been closing in on each other. This occurs when the value of the indicator stays constant for a considerable period of time.
A decrease below the lower Bollinger band (light blue) could be a strong signal that a bottom has been reached.
This would be in line with readings from other long-term indicators, which suggest a bottom is near.
USDT Balance
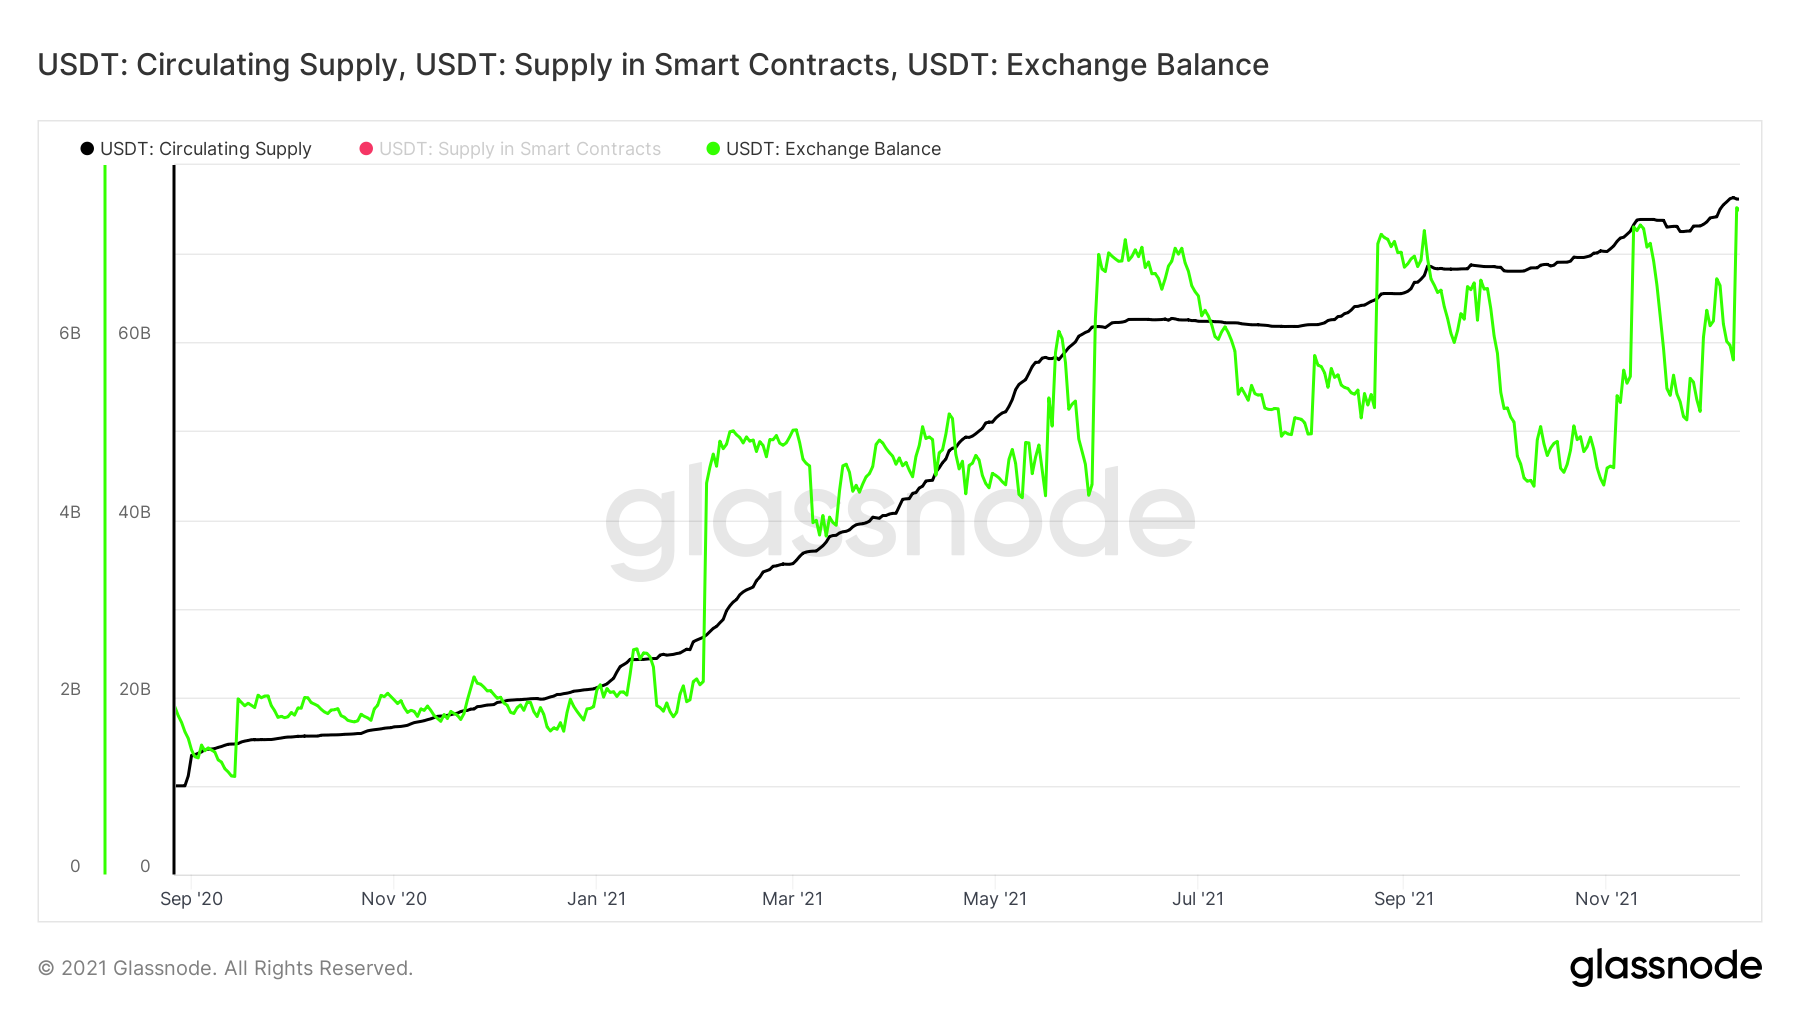
The circulating supply of USDT (black) has been steadily increasing since Sept 2020. Over the past two months, this gradual increase has been the catalyst of the slight drop in SSR, since the BTC price has stayed constant.
The USDT balance held on exchanges has also been gradually increasing, mirroring that of the circulating supply.
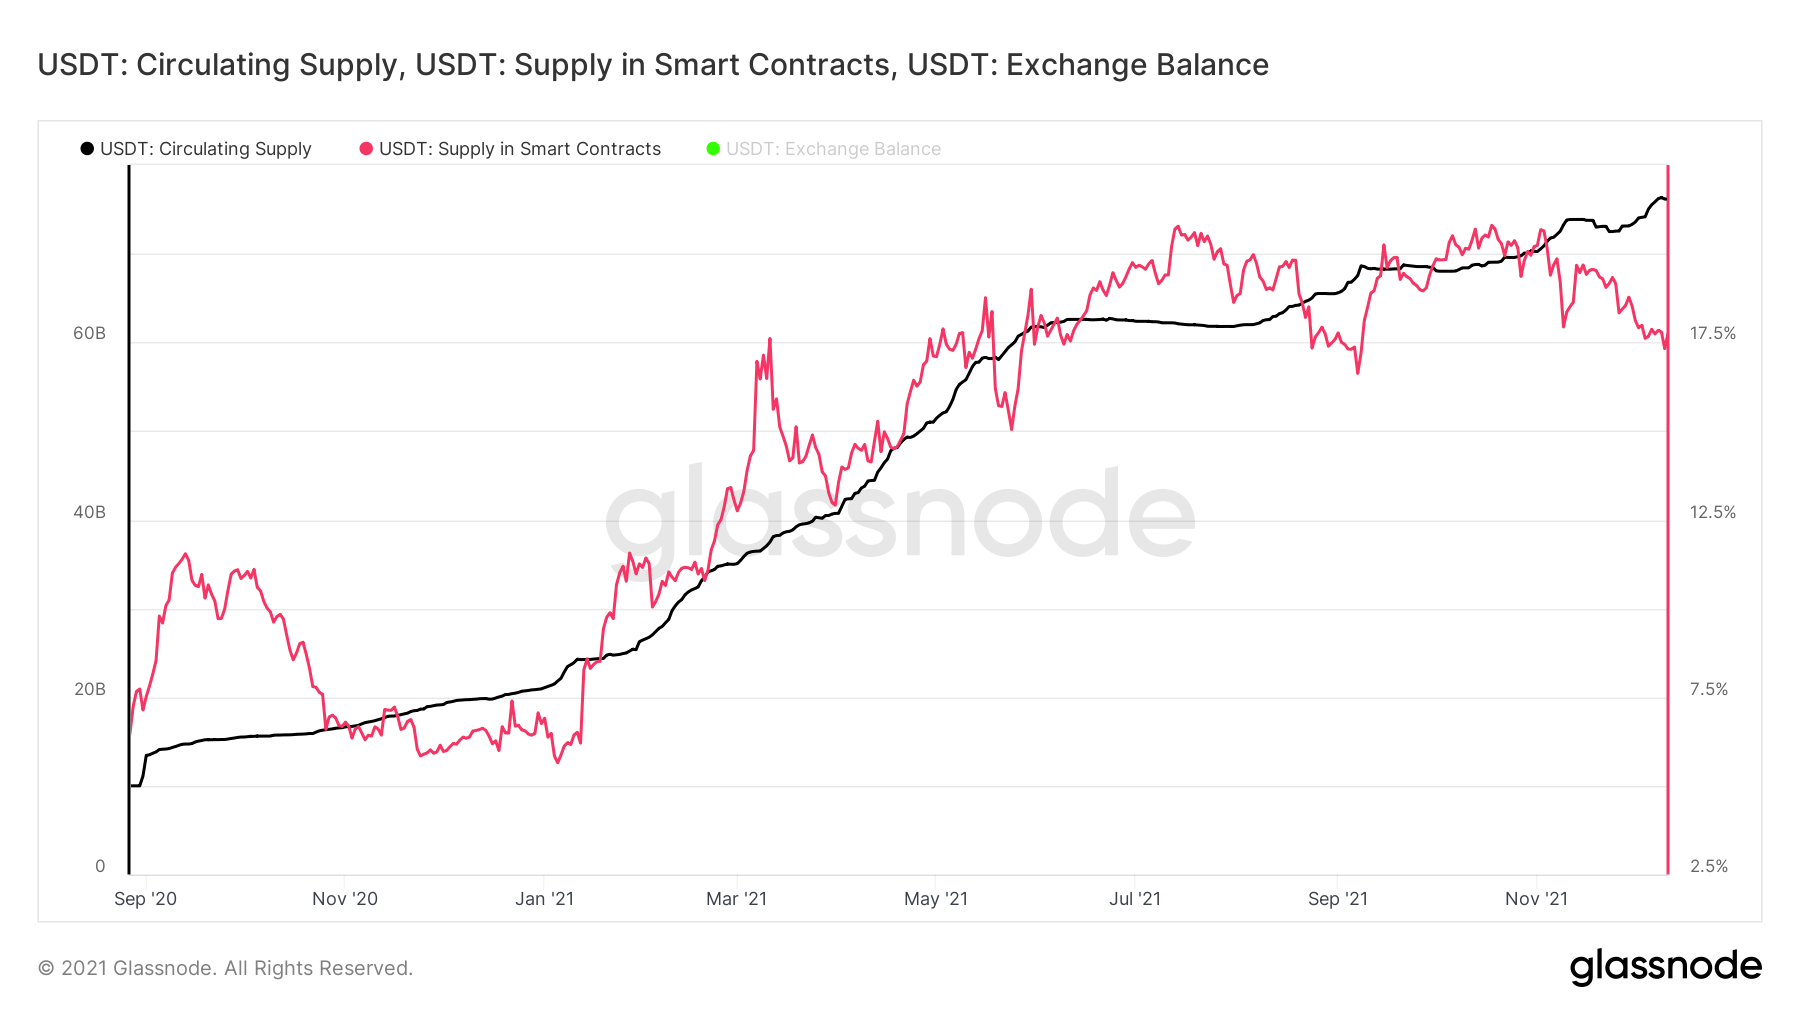
However, the USDT supply in smart contracts has been decreasing since the beginning of Oct 2020.
Therefore, the increase in the USDT circulating supply is mostly going to exchange balances rather than smart contracts.
For BeInCrypto’s latest Bitcoin (BTC) analysis, click here
Disclaimer
All the information contained on our website is published in good faith and for general information purposes only. Any action the reader takes upon the information found on our website is strictly at their own risk.