Following the Latest Drop, Was $69K the Cycle’s Top?
Options Market Analysis
25 Delta Skew and Volatility Analysis
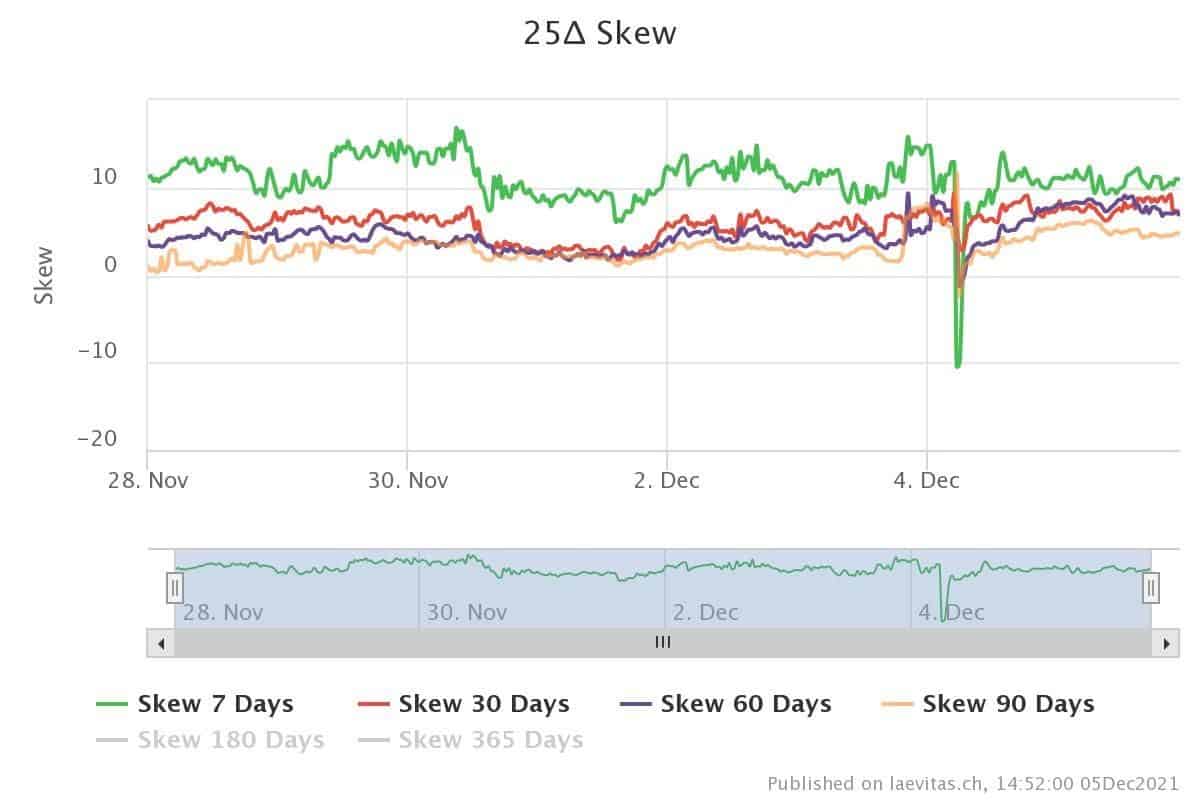
On December 4th, the bitcoin price dropped about $16k. Options traders have set different hedging strategies like buying lots of puts at $50k & $52k strike prices during the last weeks for the possible downside.
To find out what happened in the options market, It’s better to look at 25 delta Skew. This is a way of measuring the volatility skew. For example, for one month, it can be computed using the following formula: skew 1M = (IV 25 Delta put 1M – IV 25 Delta call 1M)/ATM IV 1M. The following chart shows that demand for calls increased despite the bitcoin downside on December 4th.
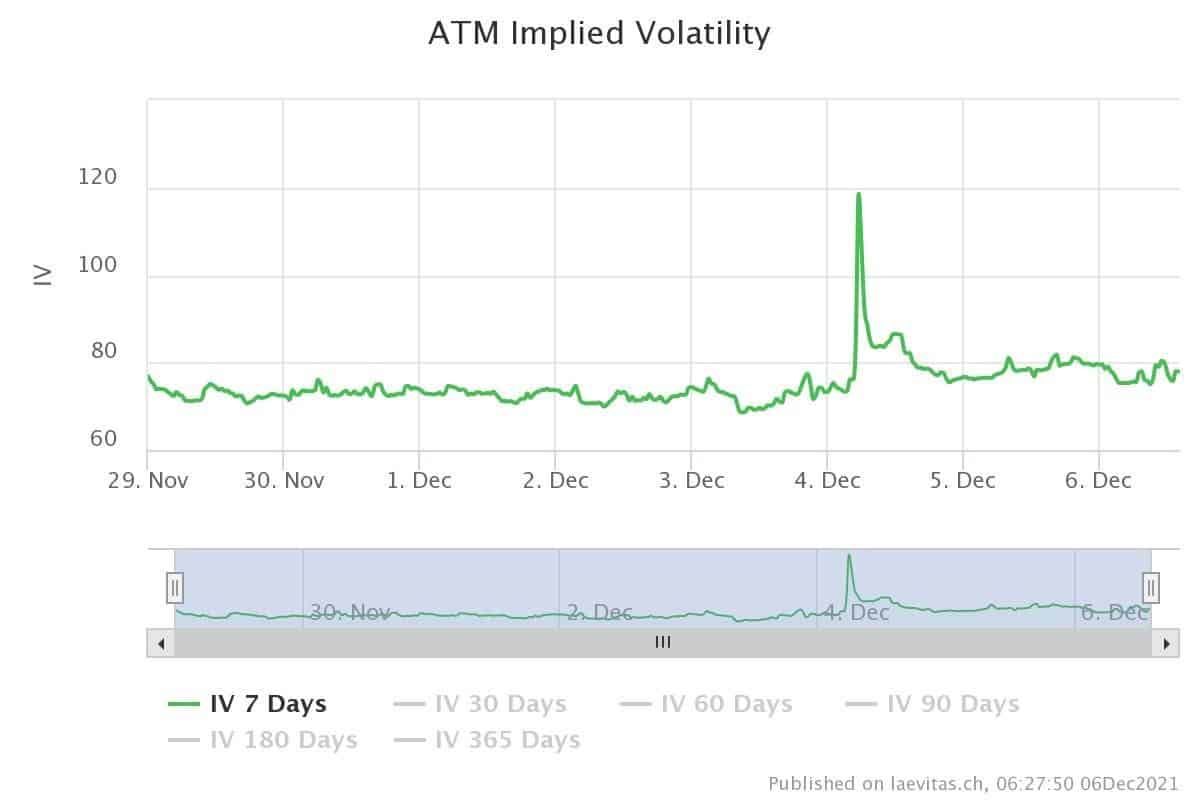
One Week Implied Volatility (IV) Spiked During the Sell-Off
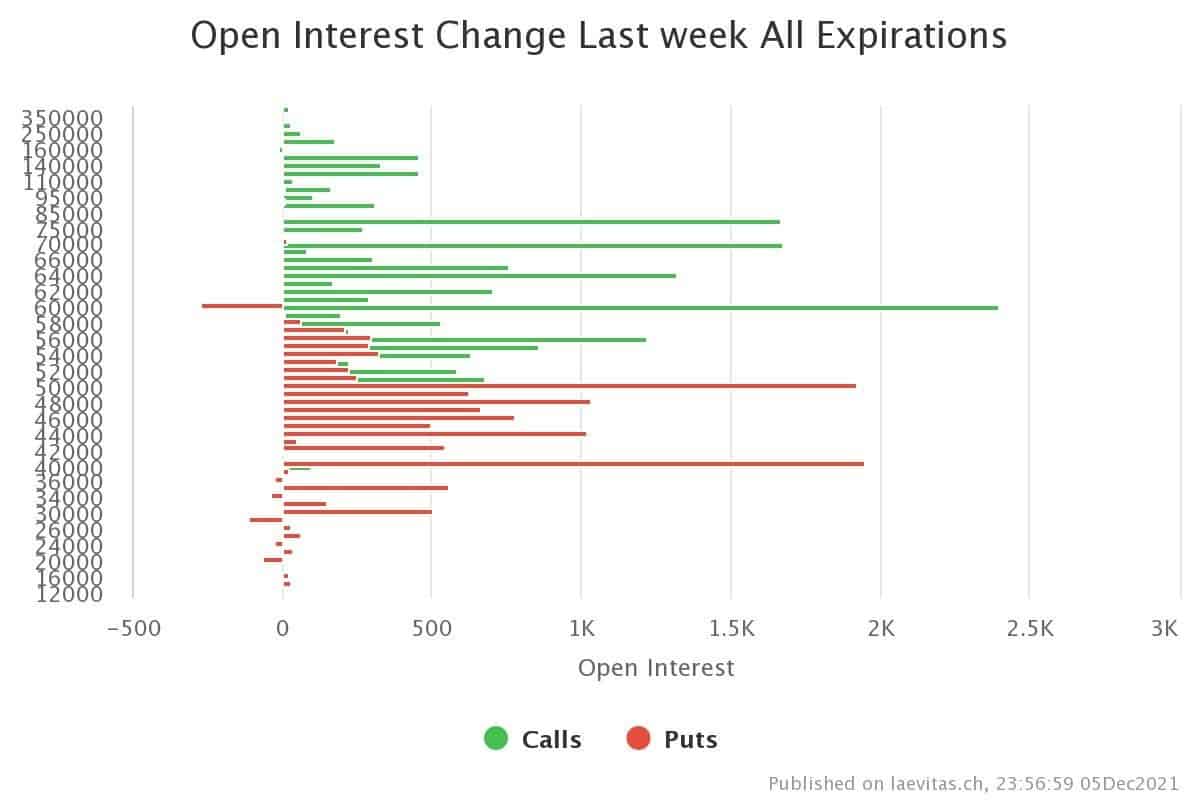
Since last week, we can see more call activities. There is demand for calls at $60k strike for expiry in December and calls for $70k & $80k strikes for expires in January and March. It seems that options traders do not think this ATH was the cycle top.
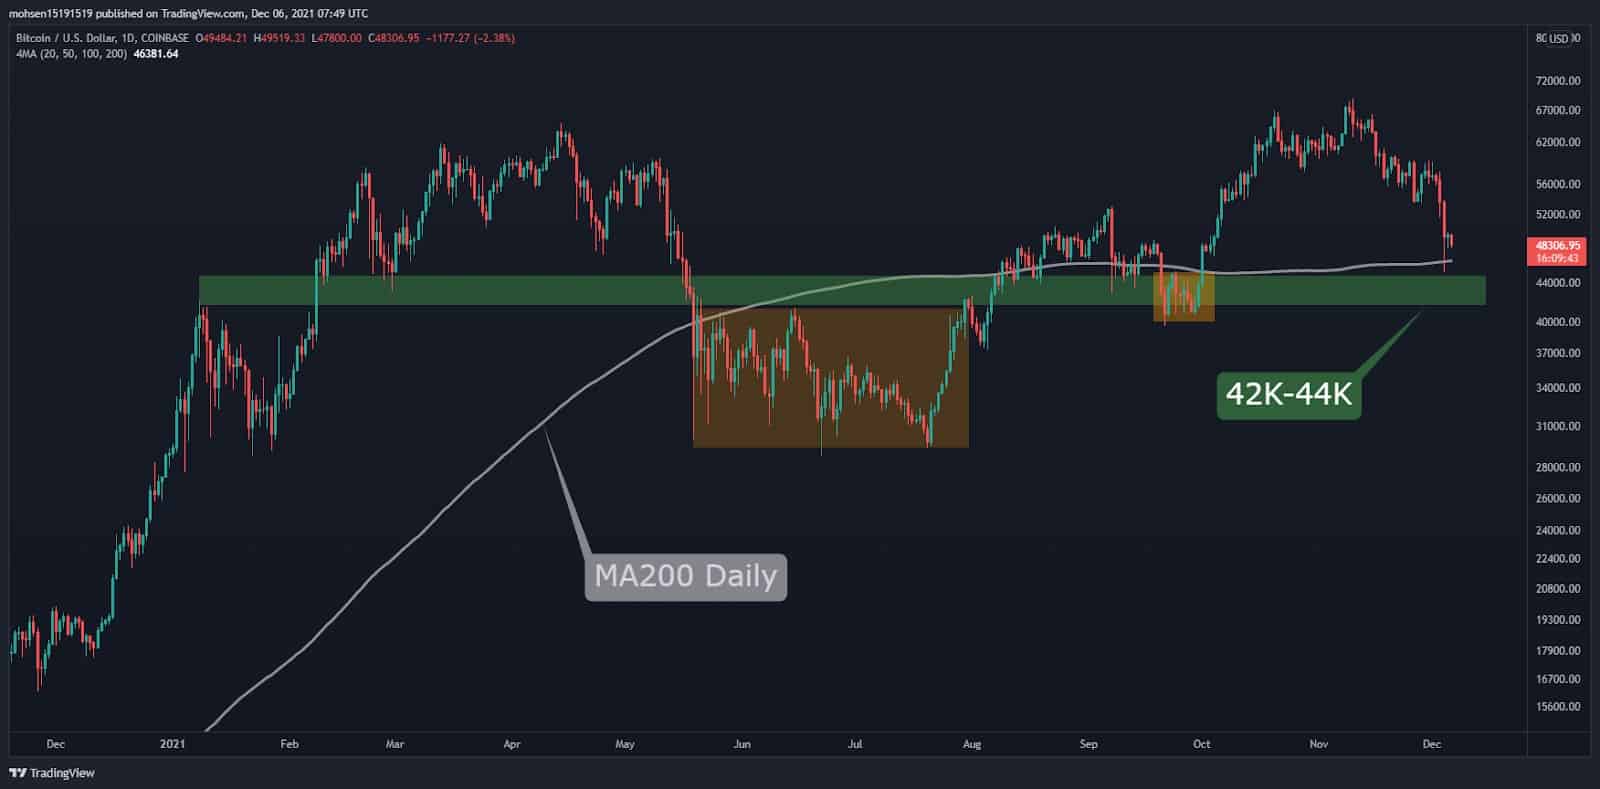
Technical Analysis
Long-Term Analysis
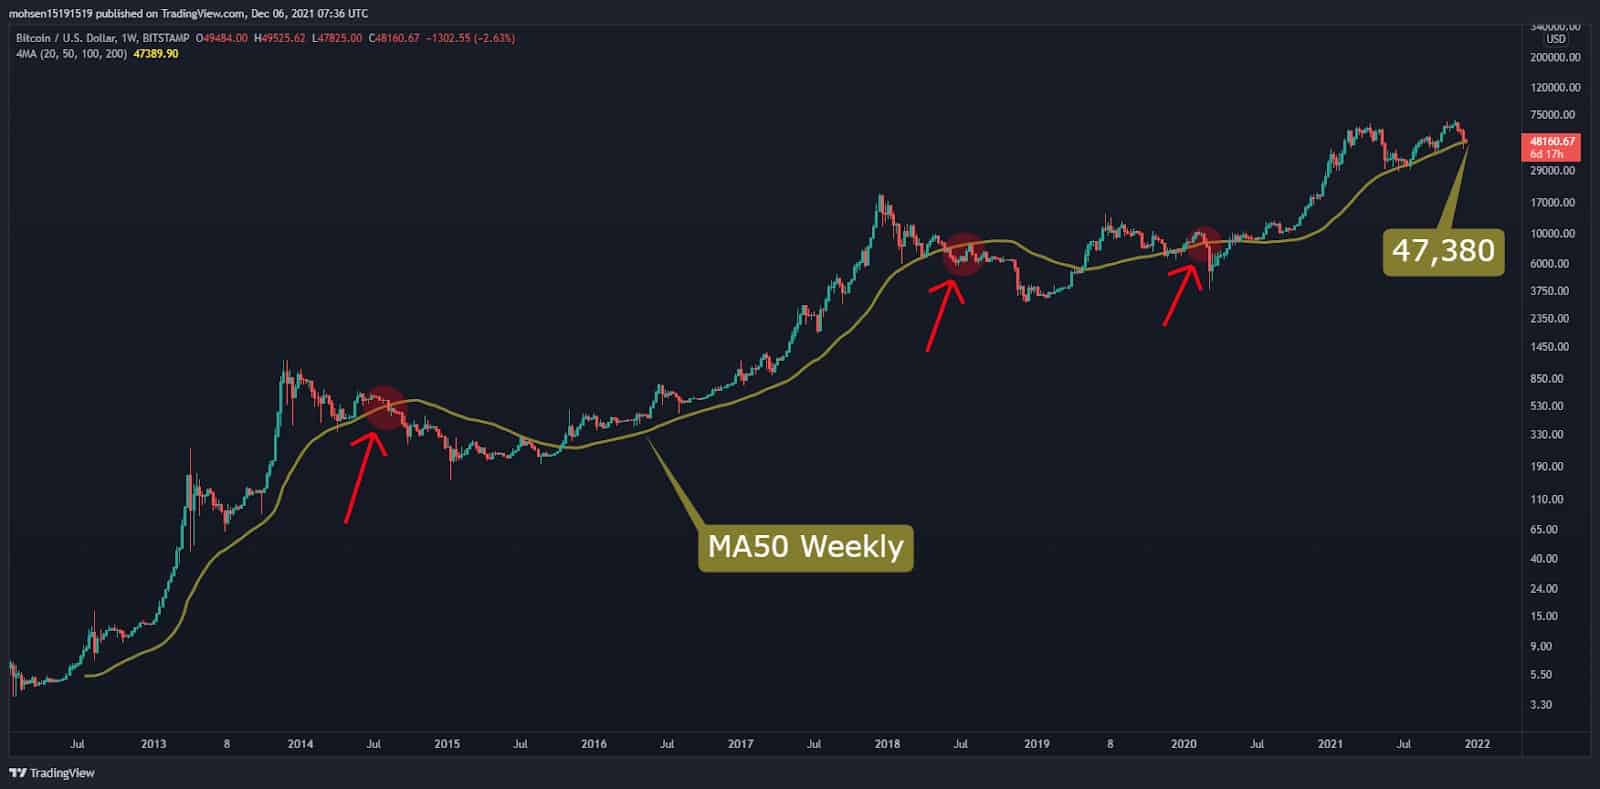
Looking at the historical trends of bitcoin on the weekly time frame, we see that it has moved above MA50 in each bull run and has dropped 60-79% whenever this Moving Average has crossed.
The MA50 is currently at $47.3K, and bulls are trying to protect that. Also, the Static support at 42k looks intense, and it is expected that bitcoin will rebound quickly if we see a temporary cross below this level.
Mid-Term Analysis
On a daily timeframe, BTC is touching the strong daily support of MA200, which intersects with the static support level (green), and bitcoin is also making a higher low in this timeframe.
Historically, losing the MA200 has led to a ranging phase that consumes the required momentum to continue the uptrend. The level of $42K-$44K seems to be strong support for BTC, but a failure of these levels would show the power of the bears.
The support to look out for is at $44K, $42K, and $37K, whereas resistance lies at $50K and $53K.
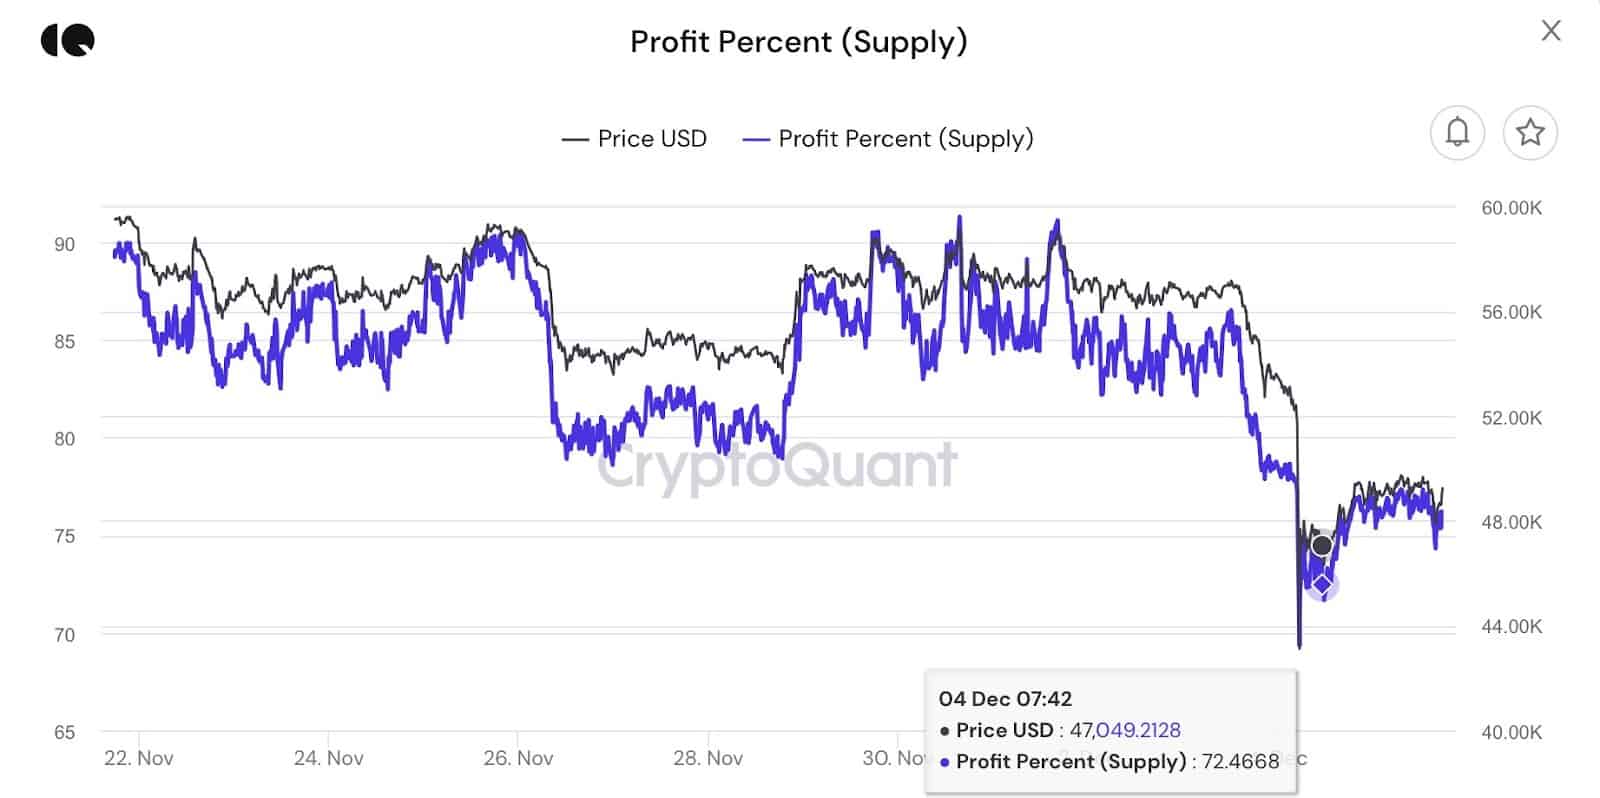
On-Chain Analysis
The top-buyers appear to be under pressure.
Almost 28% of the supply was moved above $47K. These players are (most likely) going through an exhausting ranging period in December. They are the leading sellers, and historically, they tend to sell at a loss if this exhausting phase lasts for an extended period.
The above analysis was complied by @N__E__D__A, @GrizzlyBTClover, and @CryptoVizArt. Data provided by @tsypruyan exclusively for CryptoPotato.
Binance Free $100 (Exclusive): Use this link to register and receive $100 free and 10% off fees on Binance Futures first month (terms).
PrimeXBT Special Offer: Use this link to register & enter POTATO50 code to get 50% free bonus on any deposit up to $1750.
Disclaimer: Information found on CryptoPotato is those of writers quoted. It does not represent the opinions of CryptoPotato on whether to buy, sell, or hold any investments. You are advised to conduct your own research before making any investment decisions. Use provided information at your own risk. See Disclaimer for more information.
Cryptocurrency charts by TradingView.


