Ethereum (ETH) Re-Tests Previous All-Time High Level
While the Ethereum (ETH)/USD pair is struggling to hold on above support, the ETH/BTC one is showing strong signs of an impending breakout.
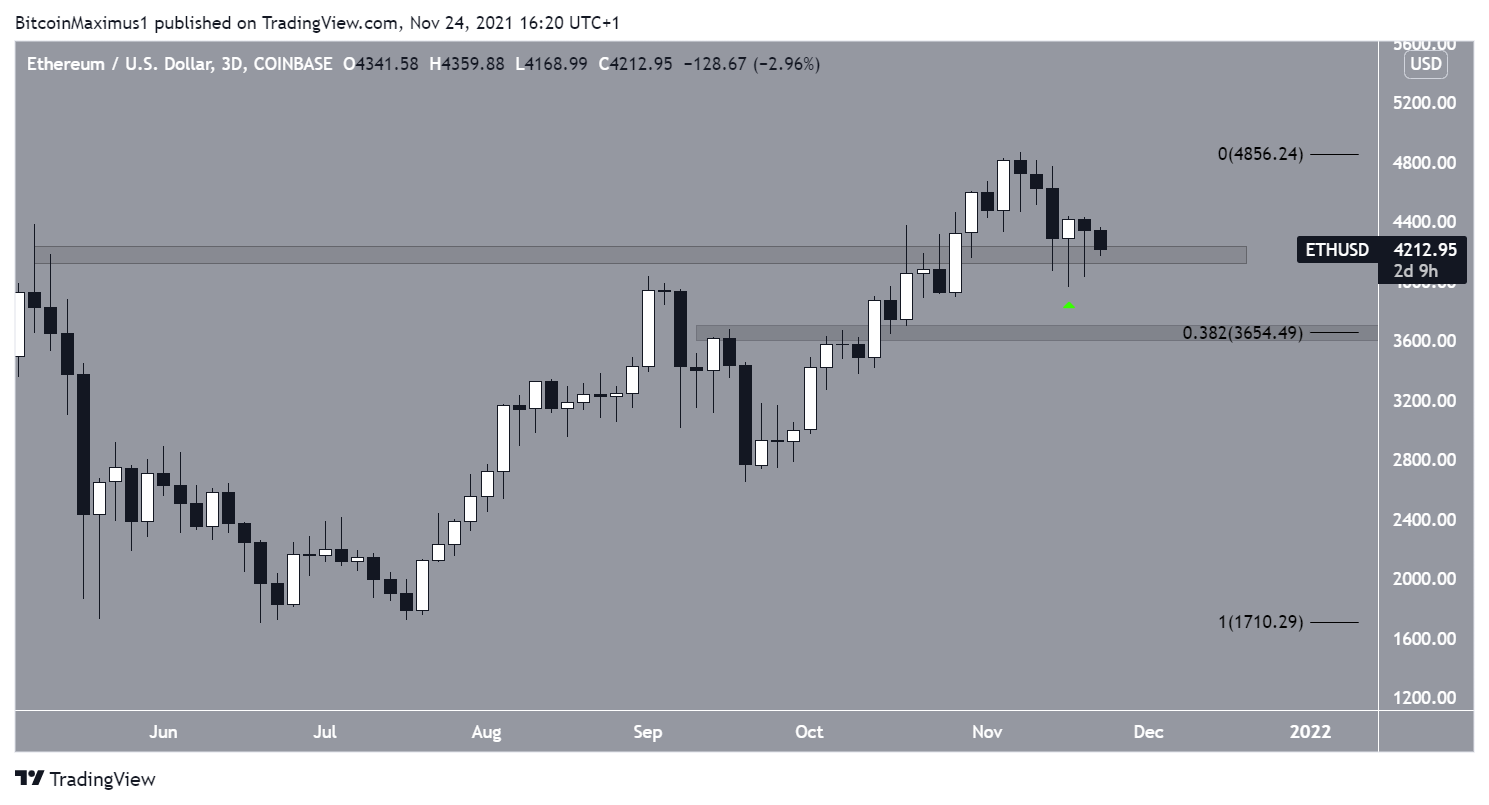
ETH has been decreasing since reaching an all-time high price of $4,867 on Nov 9. The decrease led to a low of $3,960 on Nov 18, before the token bounced. It created a long lower wick (green icon), which is considered a sign of buying pressure.
The wick transpired inside the horizontal $4,180 support area. This is a crucial area, since it previously acted as the all-time high resistance. Therefore, the current decrease looks like a re-test after a breakout.
The next support area is at $3,650. This is the 0.382 Fib retracement support level.

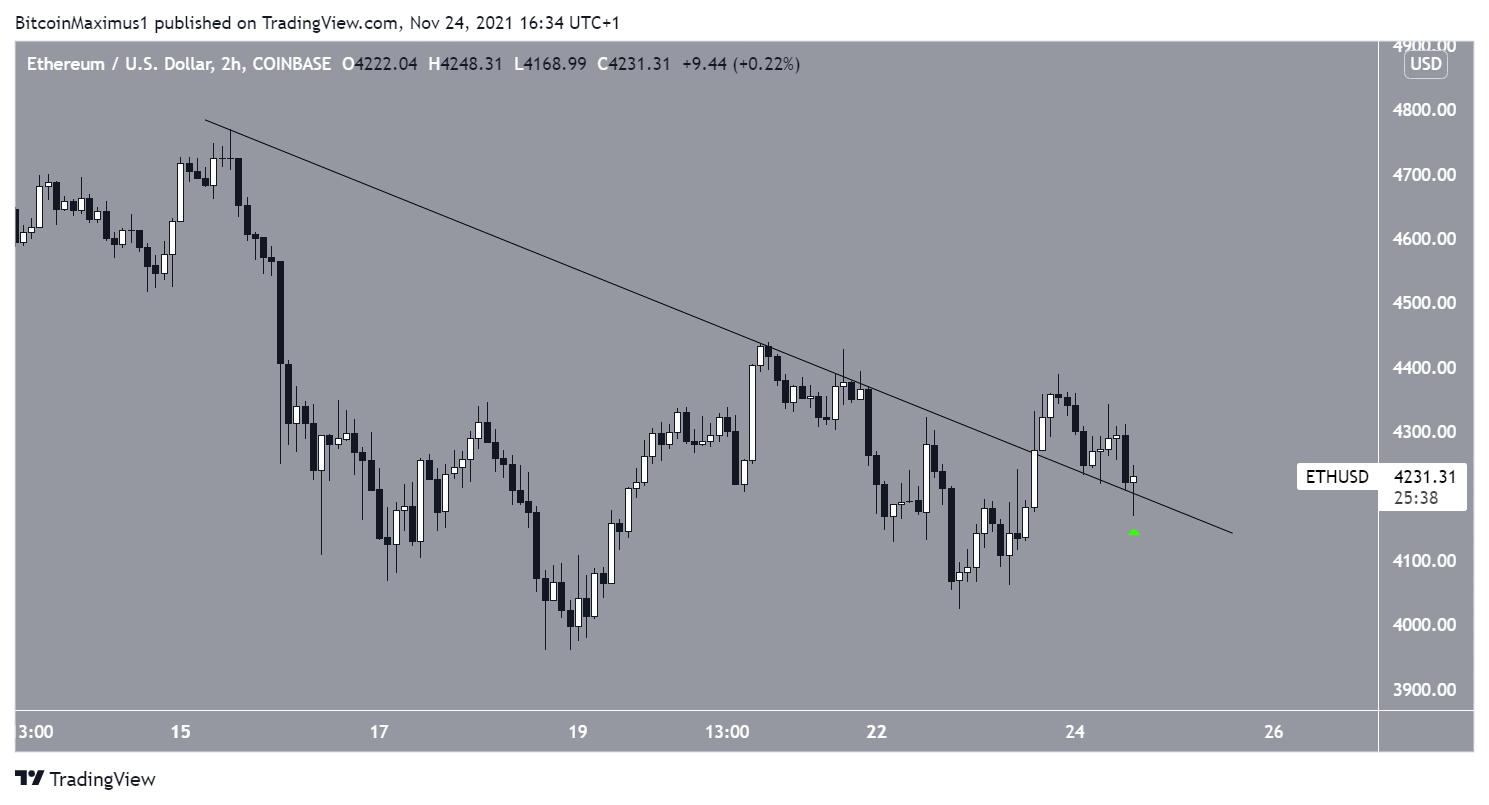
The shorter-term two-hour chart shows that ETH has broken out from a descending resistance line and validated it as support afterwards (green icon).
This is another bullish sign, that suggests the short-term correction has come to an end.
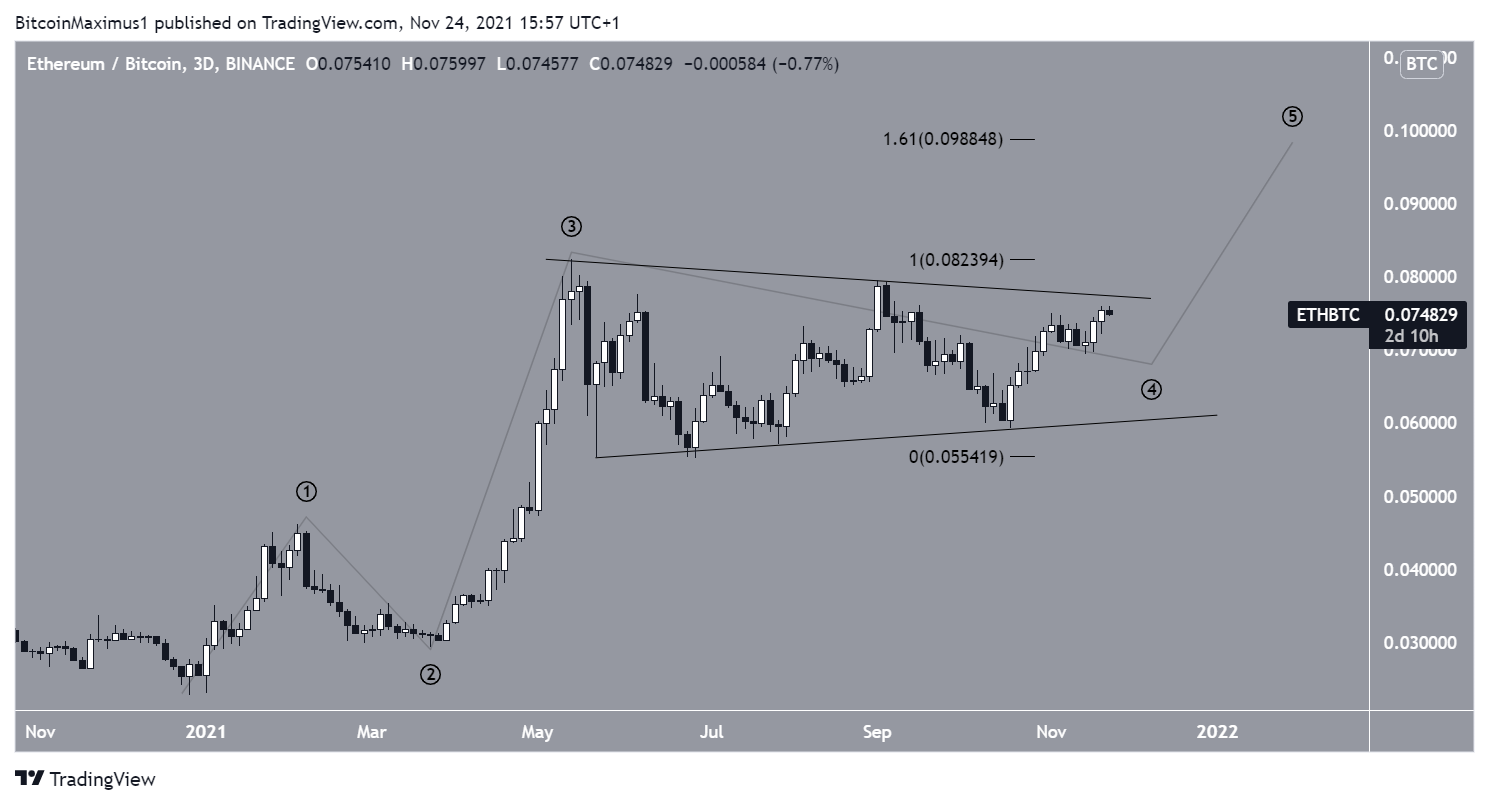
ETH/BTC
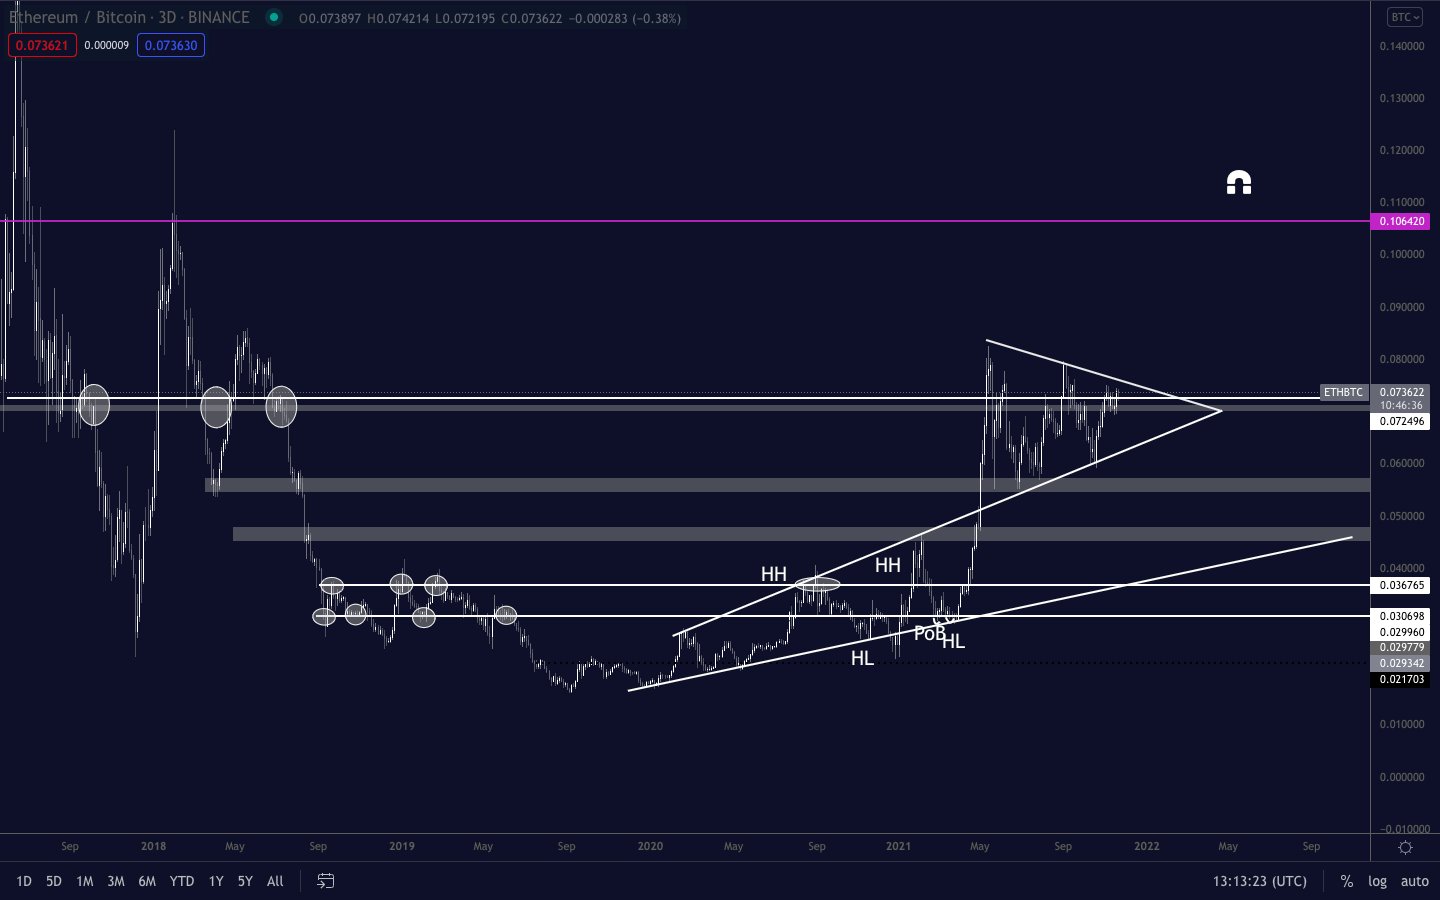
Cryptocurrency trader @Pentosh1 outlined an ETH/BTC chart, stating that the token could go all the way to ₿0.1

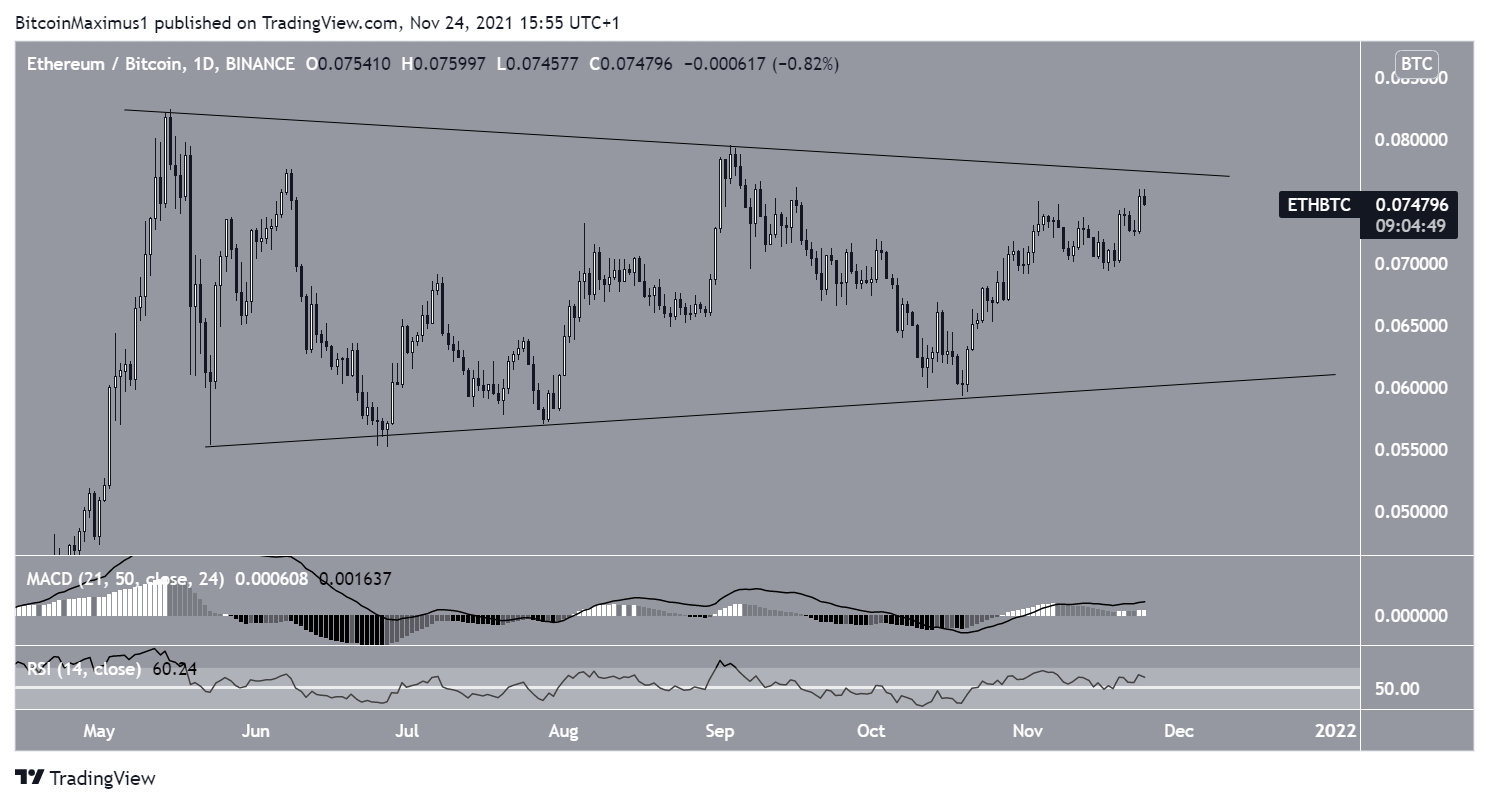
The daily chart shows that ETH is trading inside a symmetrical triangle. It has been doing so since May 13.
While the triangle is considered a neutral pattern, it is transpiring after an upward movement. Therefore, a breakout from it would be more likely than a breakdown.
Furthermore, technical indicators support the continuation of the upward movement.
The MACD, which is created by a short- and a long-term moving average (MA) is positive and moving upwards. This means that the short-term MA is moving at a faster rate than the long-term one.
Furthermore, the RSI, a momentum indicator, is above 50 and increasing. This is a sign associated with bullish trends.

The wave count also indicates that ETH/BTC is in wave four of a five wave upward movement. Wave four most often takes the shape of a symmetrical triangle. After the triangle is complete, another upward movement would be likely, which would take ETH towards new highs.
The1.61 external Fib retracement level on wave four provides a target of ₿0.099, aligning with that from the tweet.
For BeInCrypto’s latest Bitcoin (BTC) analysis, click here.
Disclaimer
All the information contained on our website is published in good faith and for general information purposes only. Any action the reader takes upon the information found on our website is strictly at their own risk.