200-day Moving Average Holds the Key to the Next Move
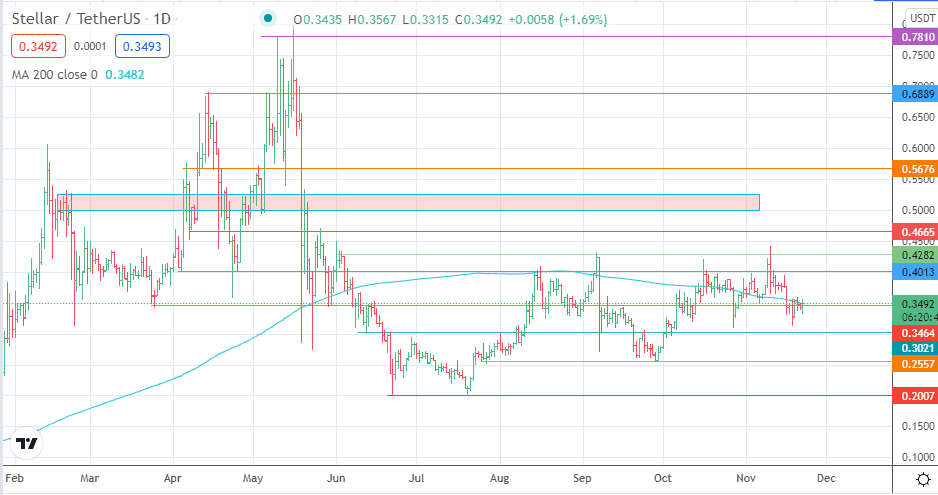
The XLM price prediction is a bit unclear at the moment, as the price is trading around the 200-day moving average without any clear intentions yet. Price action on the daily chart indicates the presence of a large symmetrical triangle, which keeps price trading in a tight range.
Aside from a brief fakeout to the upside on the 10 November candle, the price action has stayed within the confines of the pattern, maintaining its integrity.
The XLM/USDT is trading higher by 1.34% as of writing, as the price action continues to oscillate around the 200-day moving average.
XLM Price Prediction
Price action continues to fiddle around the 0.3464 price support, and this is also where the 200-day moving average lies. A break of this price level to the upside brings 0.4013 into the picture as the immediate barrier. Other barriers to the north exist at 0.4282 and 0.4665, and attainment of the latter would retest 6-month highs.
On the flip side, a rejection at 0.3464 allows for a potential dip towards 0.3021. This pivot only becomes available íf the price lows at 27 October and 18 November capitulate. If the decline is more extensive, the 0.2557 support (26 July and 28 September lows) enters the mix as additional support. If the bulls fail to defend this level, price deterioration towards 0.2007 becomes inevitable.
Stellar Lumens: Daily Chart

Follow Eno on Twitter.
