The Bitcoin Price Is Rallying Its Way To $100K
Bitcoin’s bull market continues! After difficult and painful corrections during 2021’s third quarter with deep retracements reaching 50-60% declines, bitcoin has not only regained all of its strength but also has already surpassed its April highs of $65,000. The new all-time high at $67,000 has been established, and the previous zone of weakness for bulls around $58,000 in April-May has now been reclaimed with a strong weekly close through this area. This shows that the market is way stronger at the same all-time high levels than it was in April-May. We should see an unquestionable reign of the bulls for the next few weeks with bitcoin approaching $100,000 levels faster than the majority might expect. If bitcoin’s trend does not show any weakness in the $90,000-$130,000 region, this may take bitcoin even further. Bitcoin tends to go higher than what anybody expects during bull markets, and lower than anybody predicts during bear markets.
Ideally, when bitcoin finally flies through the $70,000 milestone, it is widely believed that the momentum will again increase substantially, causing a snowball effect. The stronger the momentum gets, the more people and institutions will FOMO in expecting higher returns, and the trend should continue. This “self-fulfilling prophecy” effect may eventually cause the prices to go up even higher and faster. For that reason, the higher it goes, the less time it’s going to take to rise.
It seems that on-chain indicators align well with that thesis.
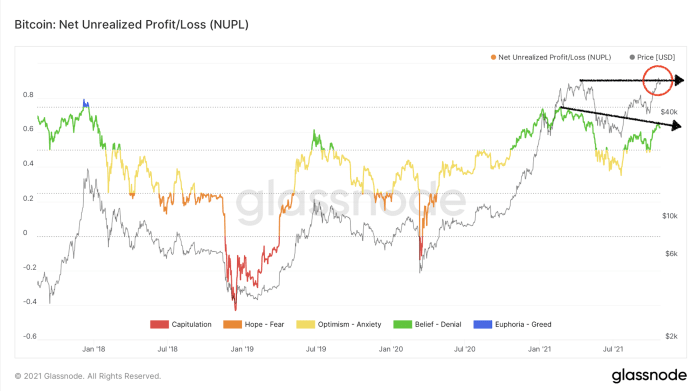
For a bit of on-chain metrics, in the past few weeks NUPL (net unrealized profit/loss indicator) has been rising very sharply and aggressively going from 0.35 on July 20 to 0.63-0.65 already, with the recent all-time high thrust.
While the price action has already breached the old all-time high, the NUPL ratio is not even close to its peak value of approximately 0.745 from April’s $65,000 levels. One way it can be interpreted is that bitcoin at current all-time highs is nowhere near as exhausted as it was in April. It shows massive strength on the on-chain side, speaking for bitcoin’s readiness to go in the upcoming weeks and months.
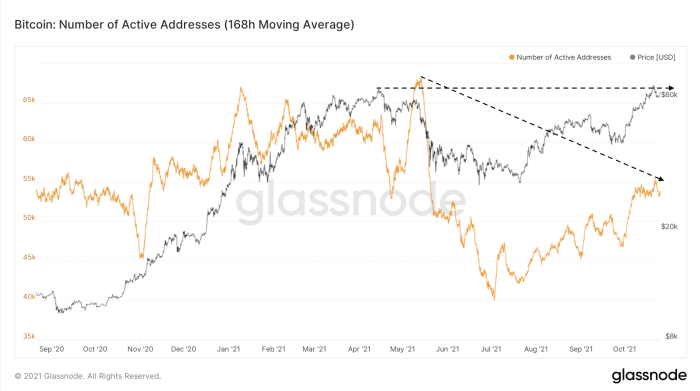
In addition, bitcoin’s “active addresses mean indicator” suggests the network is lagging behind the price.
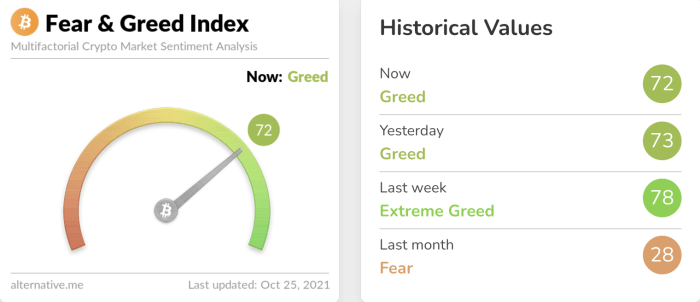
Contrary opinion trading often comes into play for bitcoin. For sentiment analysis, this is where the majority usually get it wrong. Sentiment per the fear and greed index shows BTC/USD to be at 72 of 100, which is classified under the greed category. Roughly one month ago, the market was flashing extreme fear around a $40,000 bitcoin price. It is said that the majority is correct in the middle of the trend, but always wrong at the extremes.
Finally, the magical barrier of $100,000 is less than 60% away from the current market price. Seeing more and more institutions, corporate companies, tech giants and merchants joining in with accepting cryptocurrency payments and creating new related products, the $100,000 projections don’t really seem far away from being fulfilled.
This is likely the final and last stage of the three-year coming bull market that we’ve been waiting for since December 2018 when bitcoin recorded its lows around $3100. The most exciting time in bitcoin’s history is starting now!
This is a guest post by Adrian kamil Zduńczyk. Opinions expressed are entirely their own and do not necessarily reflect those of BTC, Inc. or Bitcoin Magazine.


