ETH Needs to Break This Level to Initiate a Sustained Rally (Ethereum Price Analysis)
Ethereum increased by 25% in the past few days and seems to be a step away from shattering the line that has followed the price since its all-time high was registered in November 2021.
Technical Analysis
By Grizzly
The Daily Chart
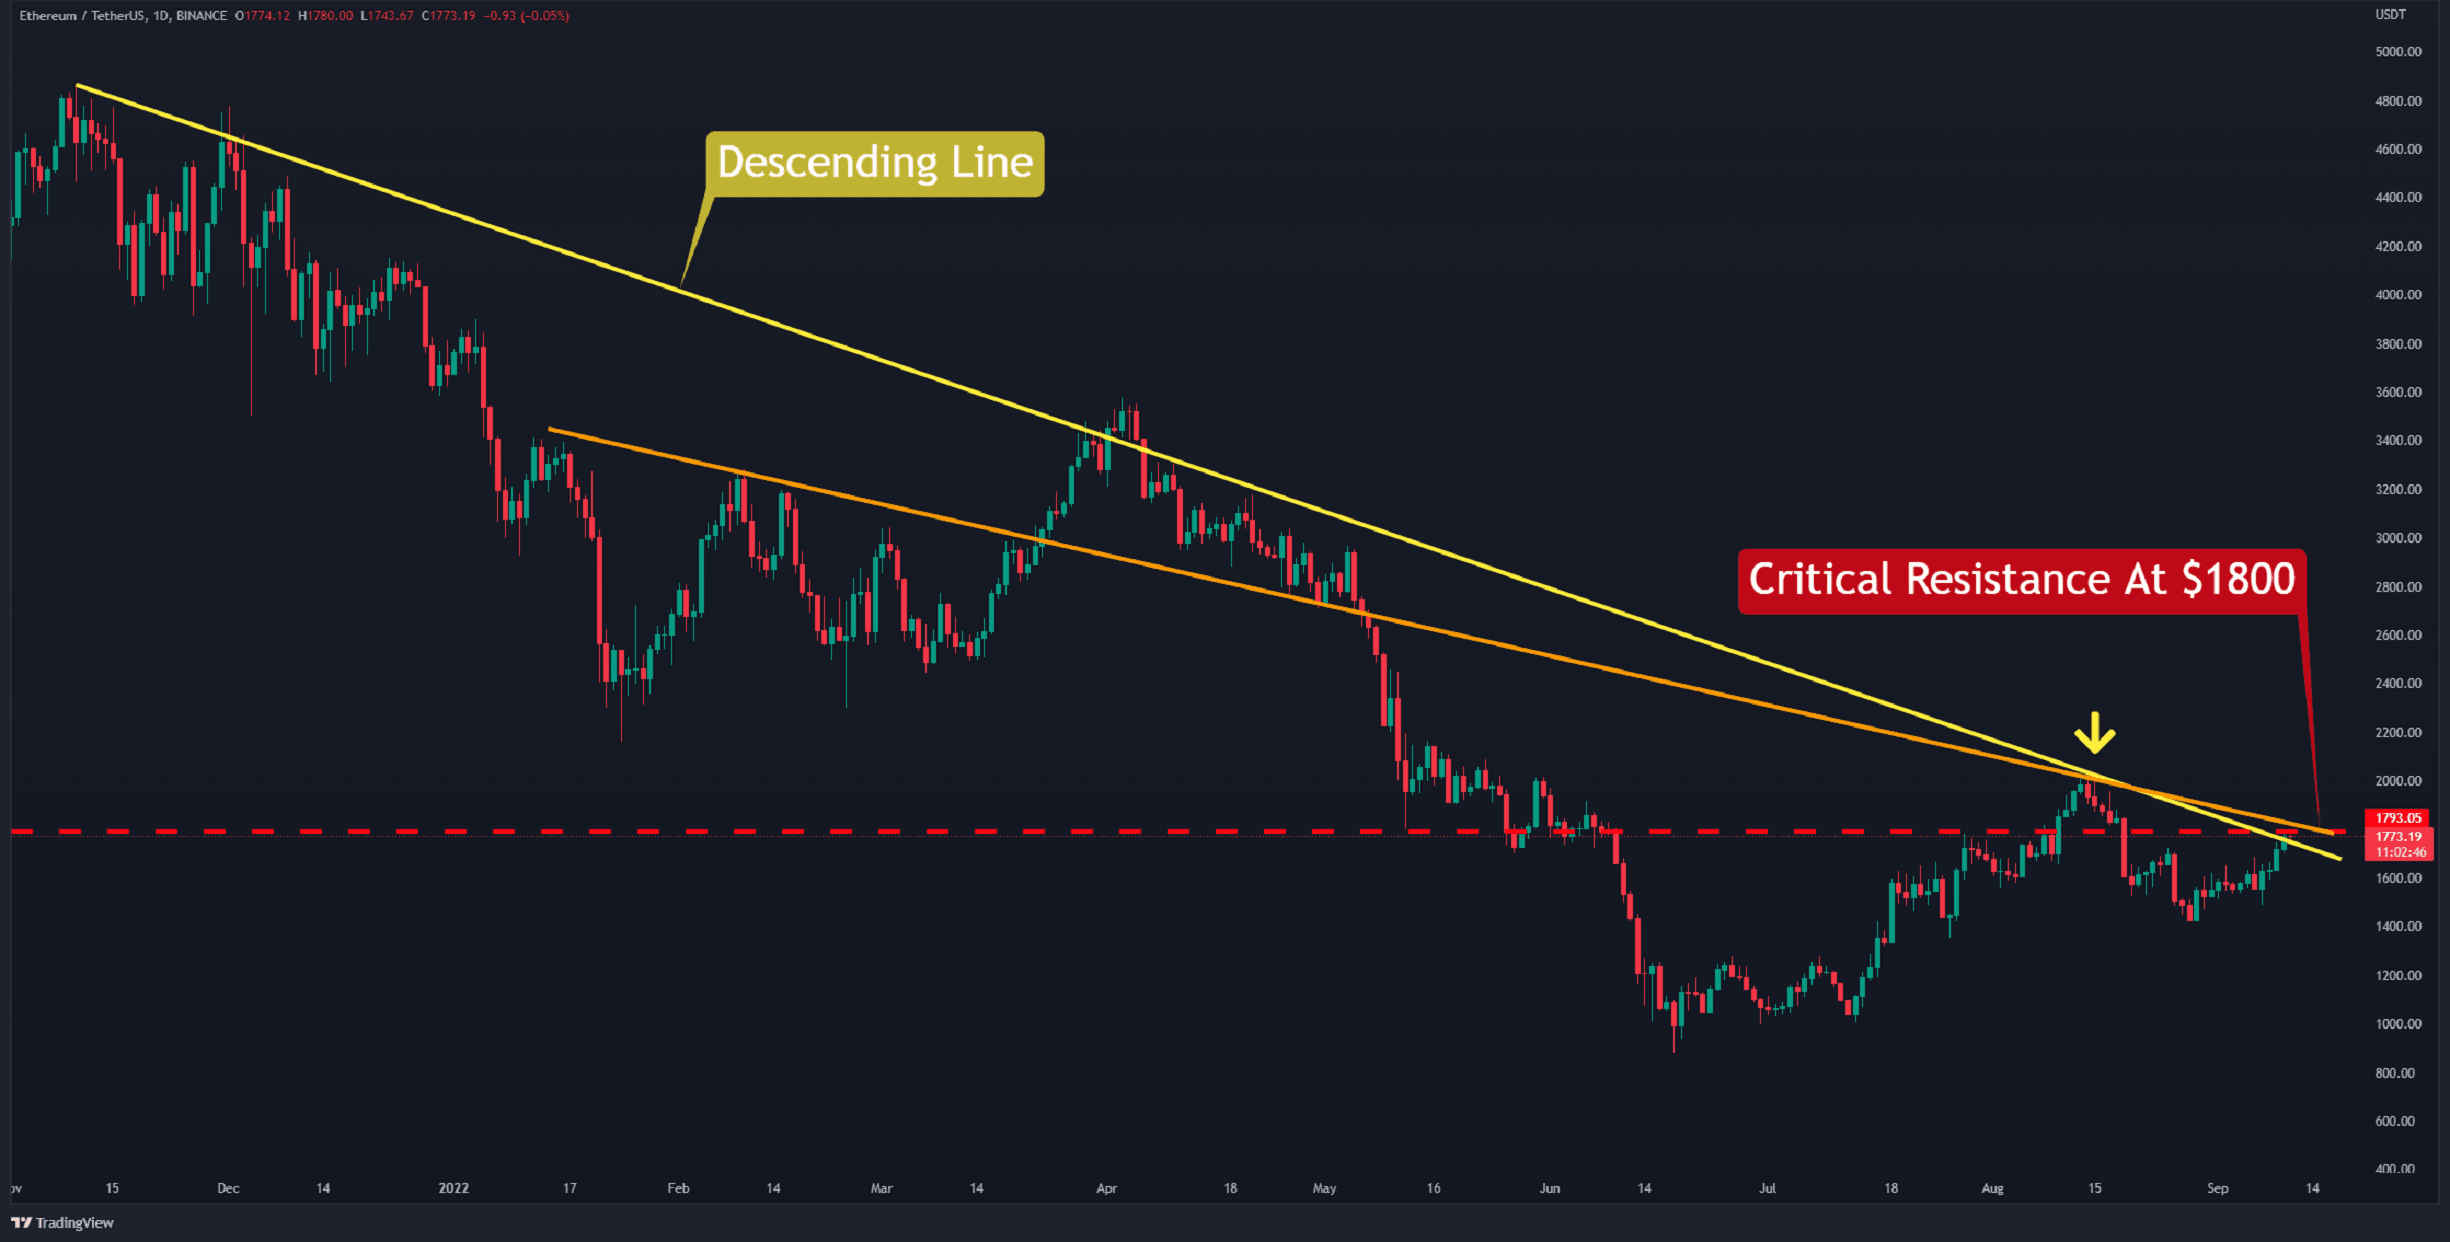
Ethereum has reached an obstacle on the daily chart. A significant resistance zone has been established by the convergence of two descending lines (in yellow and orange) and the horizontal resistance at $1,800 (in red).
On August 14, the bulls’ final effort to break out was unsuccessful. Since then, the price moved into a weaker position, reaching $1,420. The recent increase has now presented the bulls with an opportunity to retest the resistance zone.
In the days leading up to the Merge, the market is dominated by bullish sentiment, and this will be amplified if the bulls can reclaim $2K. Alternately, failure to break this level will end expectations of a rally. If this occurs, the first area of solid support lies around $1,400.
In conclusion, it is crucial to observe the daily structure during the next couple of days. The strength of the upper wicks, which shows how determined the bears are to defend the resistance zone, is also important to monitor.
Key Support Levels: $1650 & $1420
Key Resistance Levels: $1800 & $2100
Daily Moving Averages:
MA20: $1581
MA50: $1660
MA100: $1490
MA200: $2101
The ETH/BTC Chart
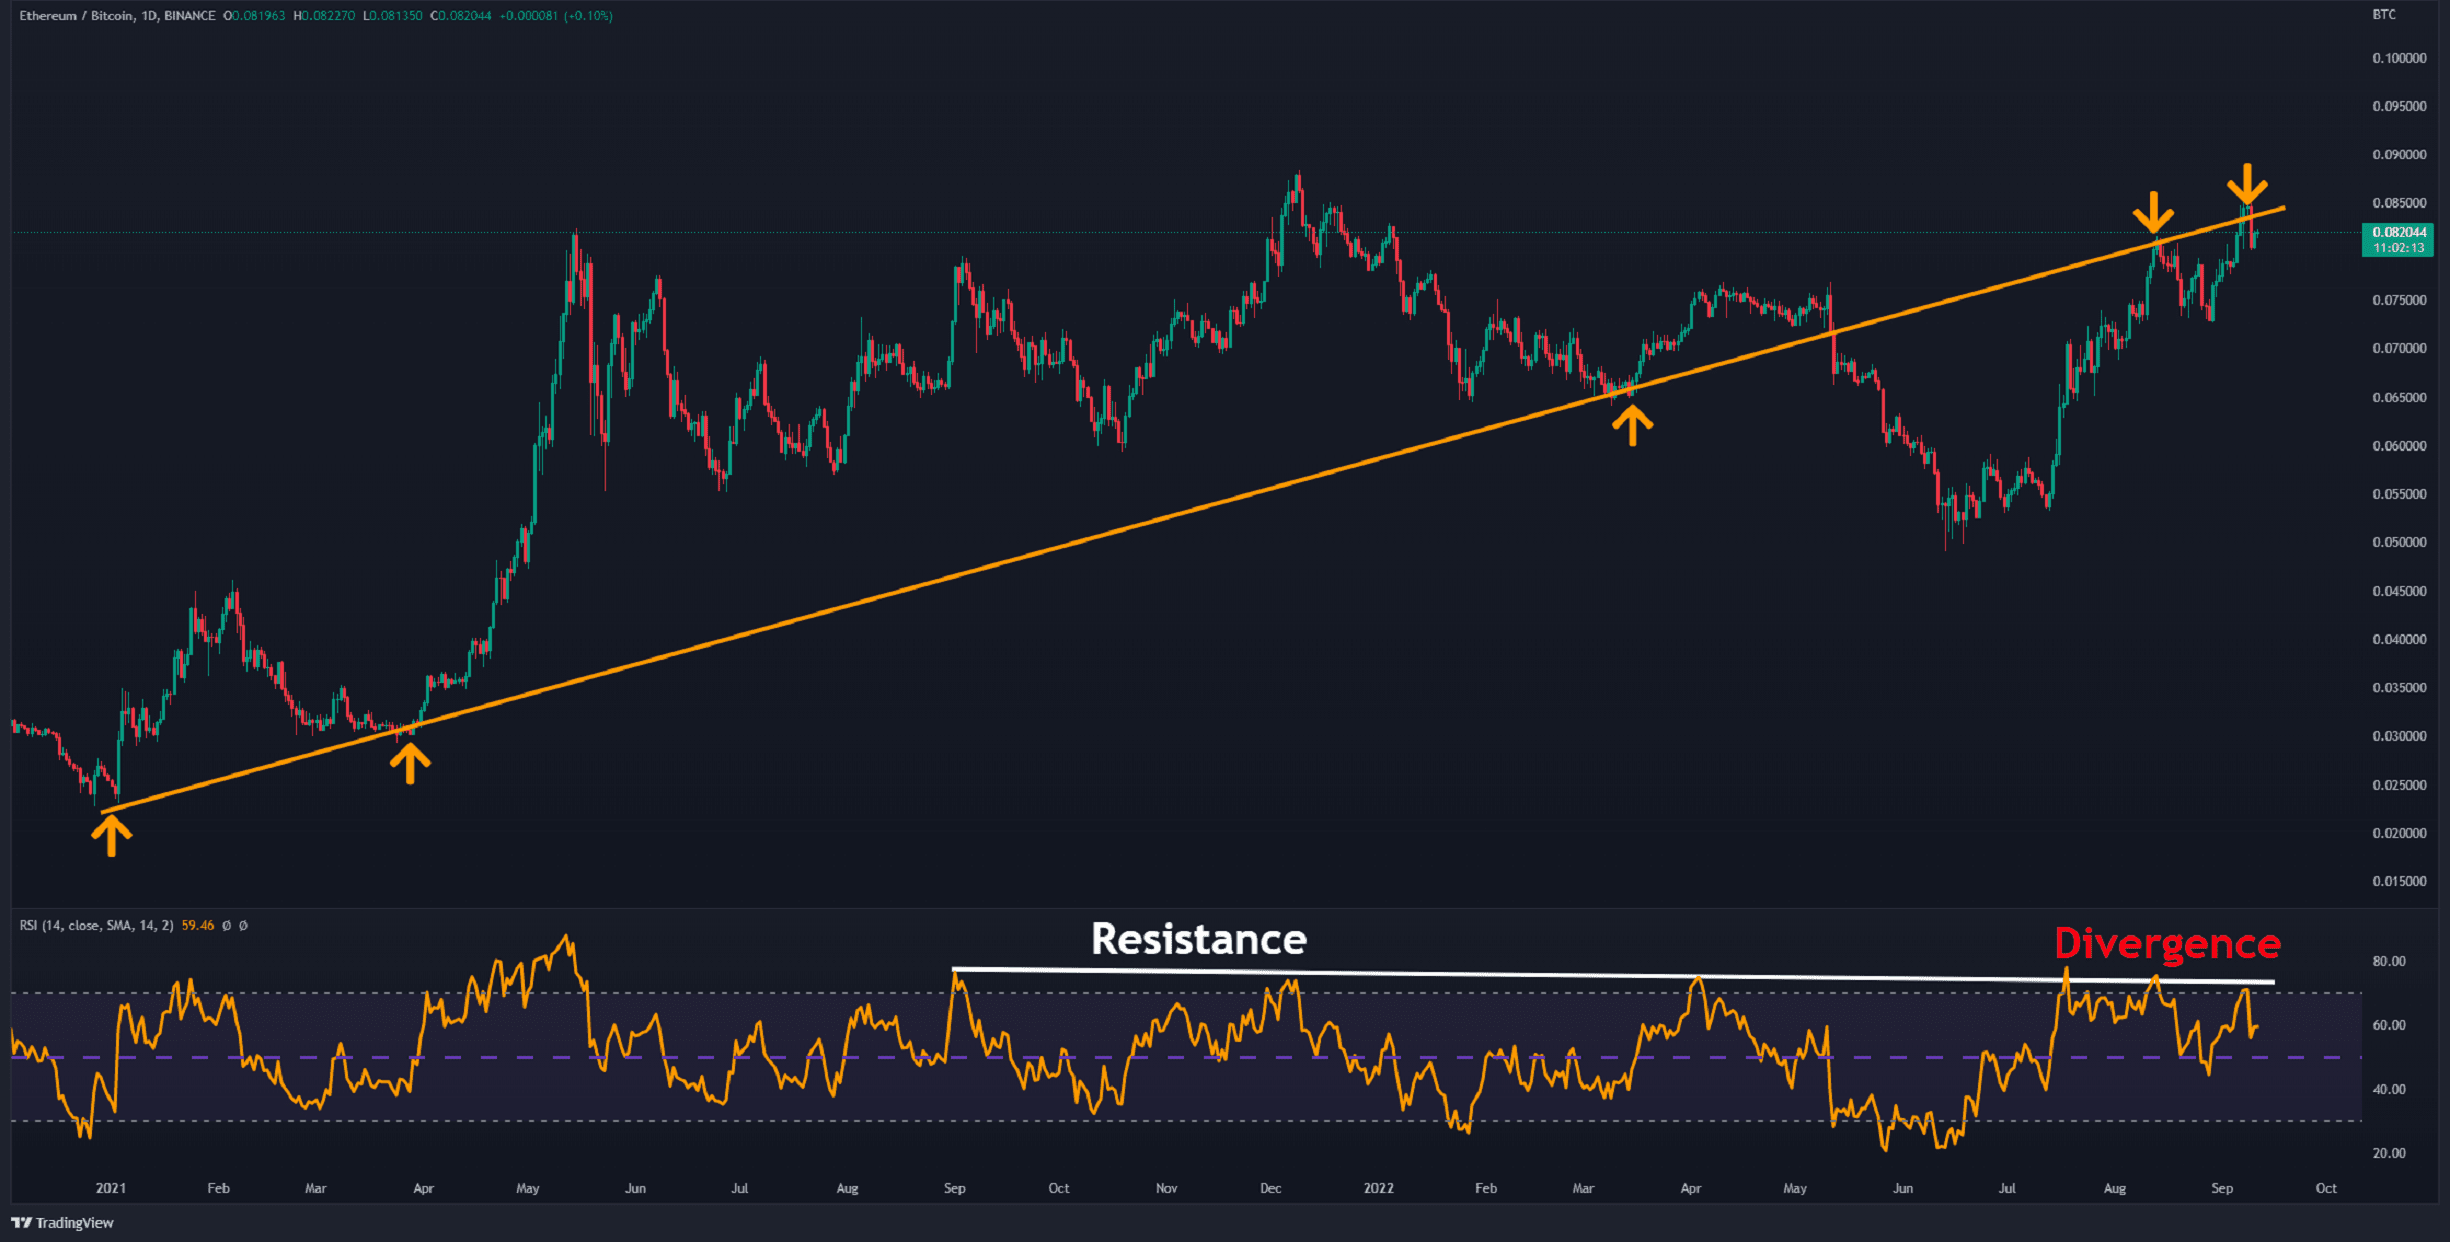
On the ETH/BTC chart, the ascending line (in orange) is now acting as resistance. Additionally, for the third time in 50 days, the 14-day Relative Strength Index (RSI) has encountered resistance at the descending line (in white) after reaching above 70 again. This is considered an overbought zone, and because of the negative divergence (in red), it appears the trend is steadily becoming weaker.
A trend reversal can be initiated with a break and close below 0.08 BTC. The next support in this situation will likely be found at 0.073 BTC.
Key Support Levels: 0.0.0.08 & 0.073 BTC
Key Resistance Levels: 0.088 & 0.093 BTC
Binance Free $100 (Exclusive): Use this link to register and receive $100 free and 10% off fees on Binance Futures first month (terms).
PrimeXBT Special Offer: Use this link to register & enter POTATO50 code to receive up to $7,000 on your deposits.
Disclaimer: Information found on CryptoPotato is those of writers quoted. It does not represent the opinions of CryptoPotato on whether to buy, sell, or hold any investments. You are advised to conduct your own research before making any investment decisions. Use provided information at your own risk. See Disclaimer for more information.
Cryptocurrency charts by TradingView.


