Solana (SOL) Plunges 38% In a Month
Solana (SOL) has faced intense selling pressure, recently dropping below $120 – its lowest level since February 2024. It has declined more than 38% over the past 30 days, reinforcing its bearish momentum.
With sellers firmly in control, SOL now faces a critical test of support levels, while any potential recovery would need to break through key resistance zones to signal a shift in momentum.
Solana Ichimoku Cloud Shows a Strong Bearish Setup
Solana Ichimoku Cloud shows that the price is currently trading below both the blue Tenkan-sen (conversion line) and the red Kijun-sen (base line), indicating that the short-term trend remains bearish.
The price recently bounced from a local low but has not yet reclaimed these key resistance levels. Additionally, the Ichimoku cloud (Kumo) ahead is red, reflecting bearish sentiment in the market.
The cloud itself is positioned well above the current price, suggesting that even if SOL experiences a short-term recovery, it will likely face strong resistance near the $130 – $135 region.
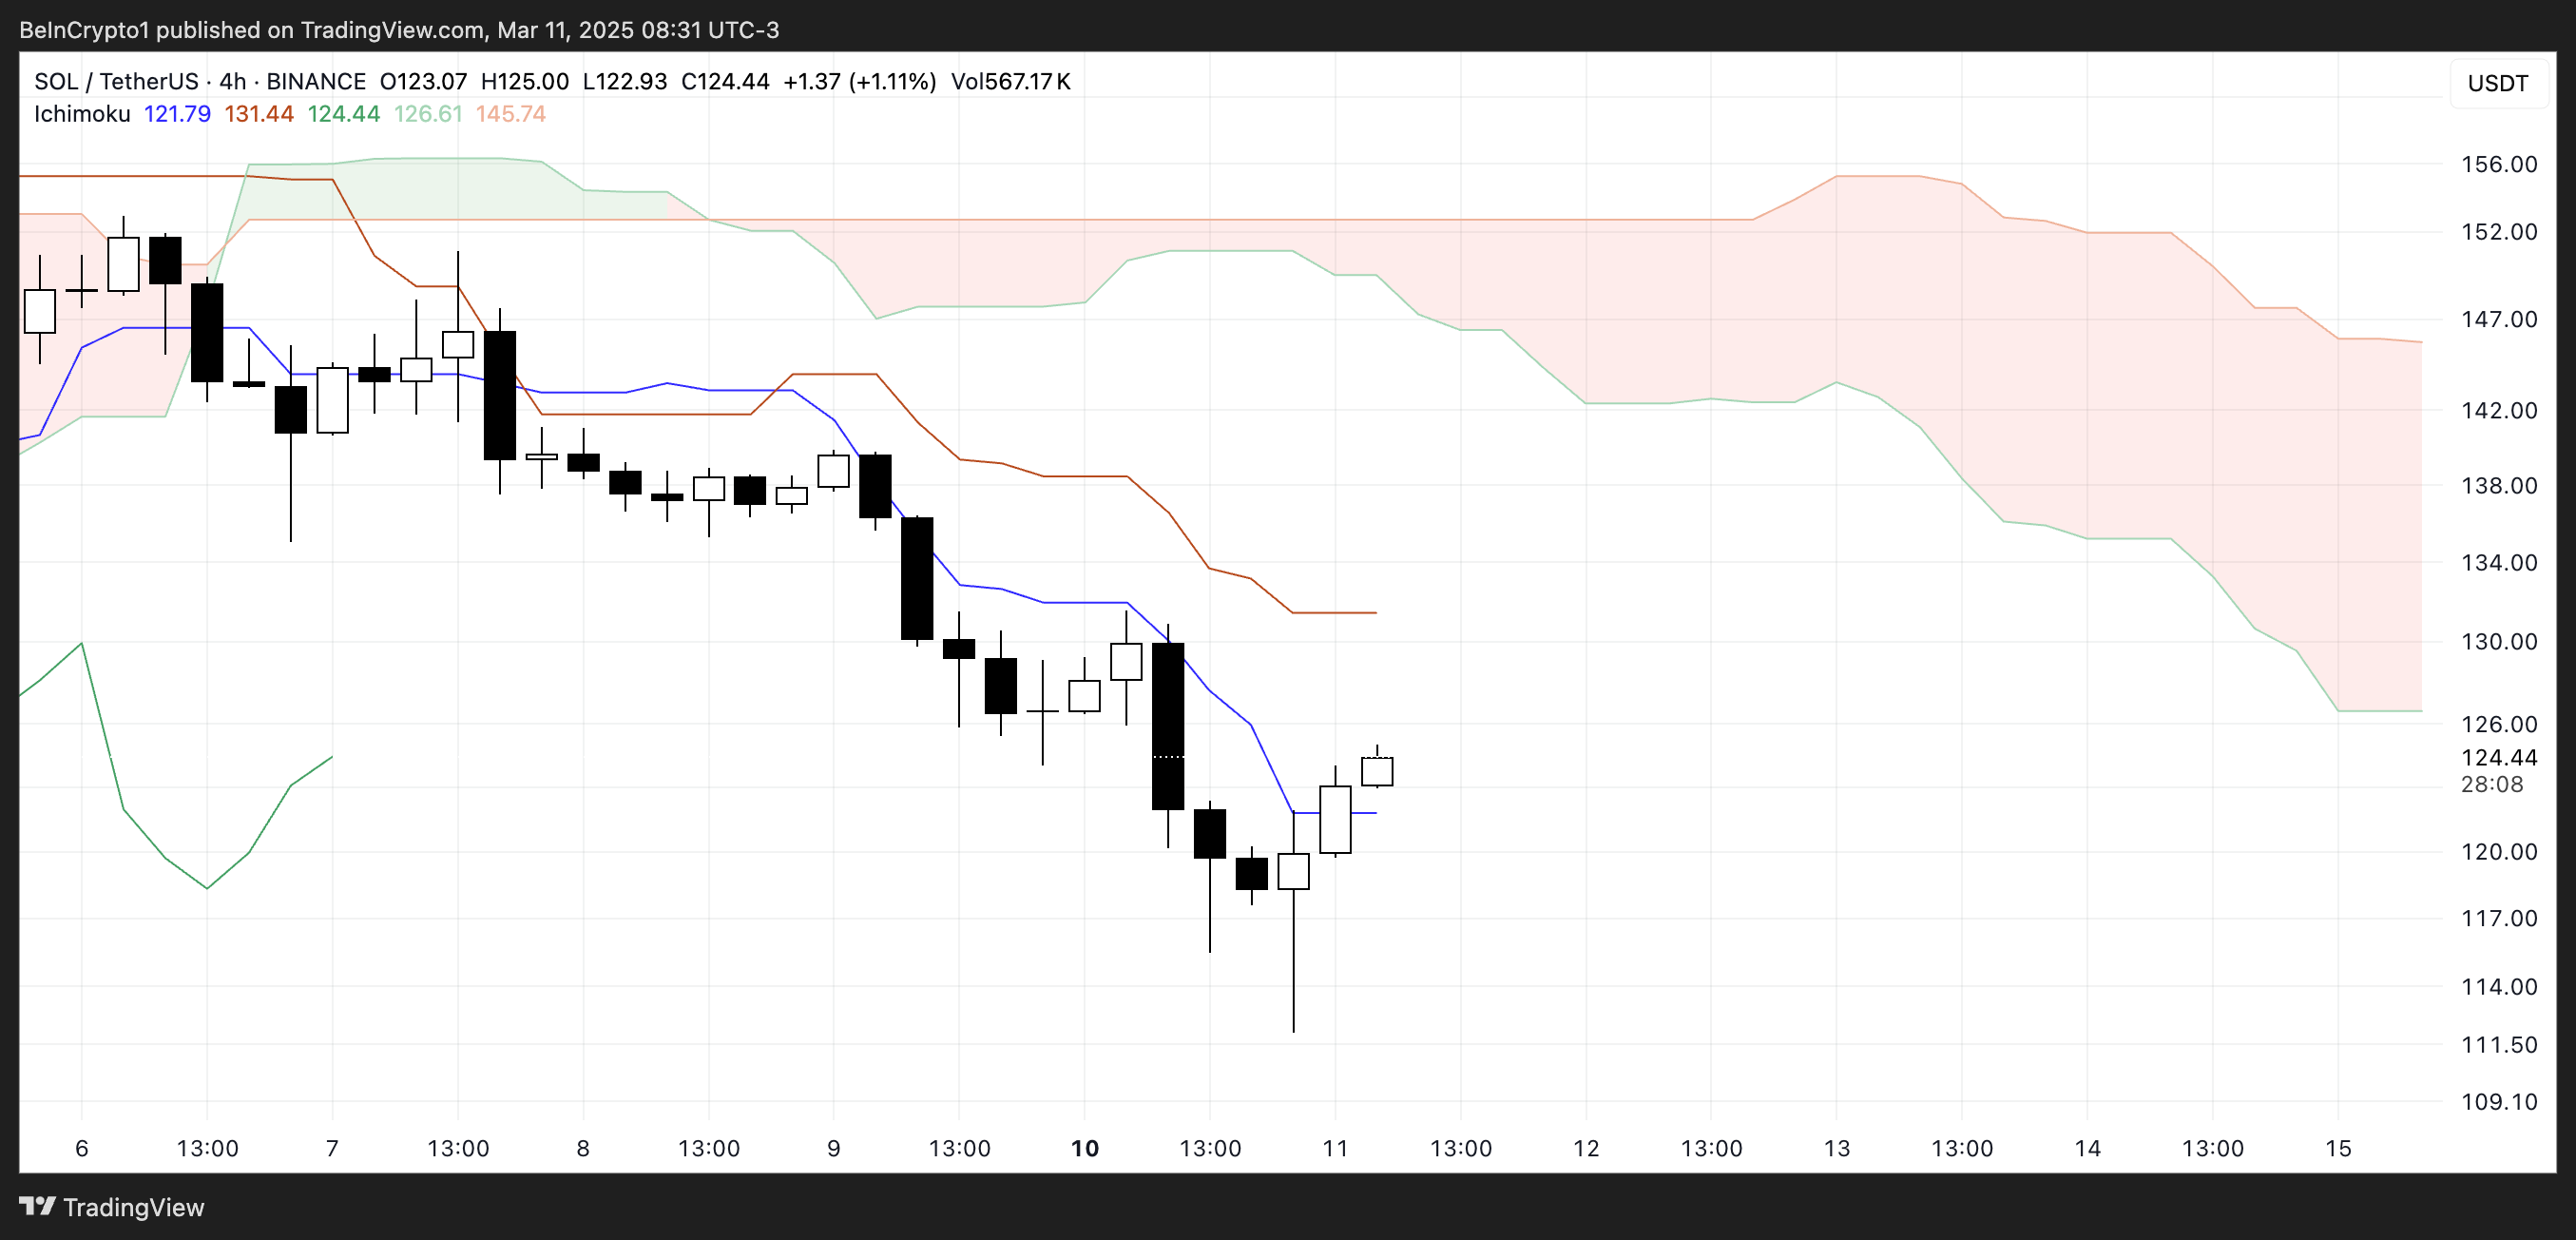
The positioning of the Tenkan-sen below the Kijun-sen further supports the bearish outlook, as this crossover typically signals downward momentum.
For any signs of a trend reversal, SOL would need to break above both of these lines and ideally enter the cloud, which would indicate a potential transition to a neutral phase.
Until then, the bearish cloud ahead and the current weak price structure suggest that any rallies may be temporary before the broader downtrend resumes.
SOL DMI Shows Sellers Are Still In Control
Solana Directional Movement Index (DMI) chart reveals that its Average Directional Index (ADX) is currently at 33.96, a significant increase from 13.2 just two days ago.
The ADX measures trend strength, and a reading above 25 typically indicates a strong trend, while values below 20 suggest a weak or non-existent trend. Given this sharp rise, it confirms that SOL’s ongoing downtrend is gaining strength.
The +DI (positive directional index) has dropped to 11.71 from 15.5 two days ago but has slightly rebounded from 8.43 yesterday. In contrast, the -DI (negative directional index) sits at 32.2, up from 25.9 two days ago, though slightly down from 35 a few hours ago.
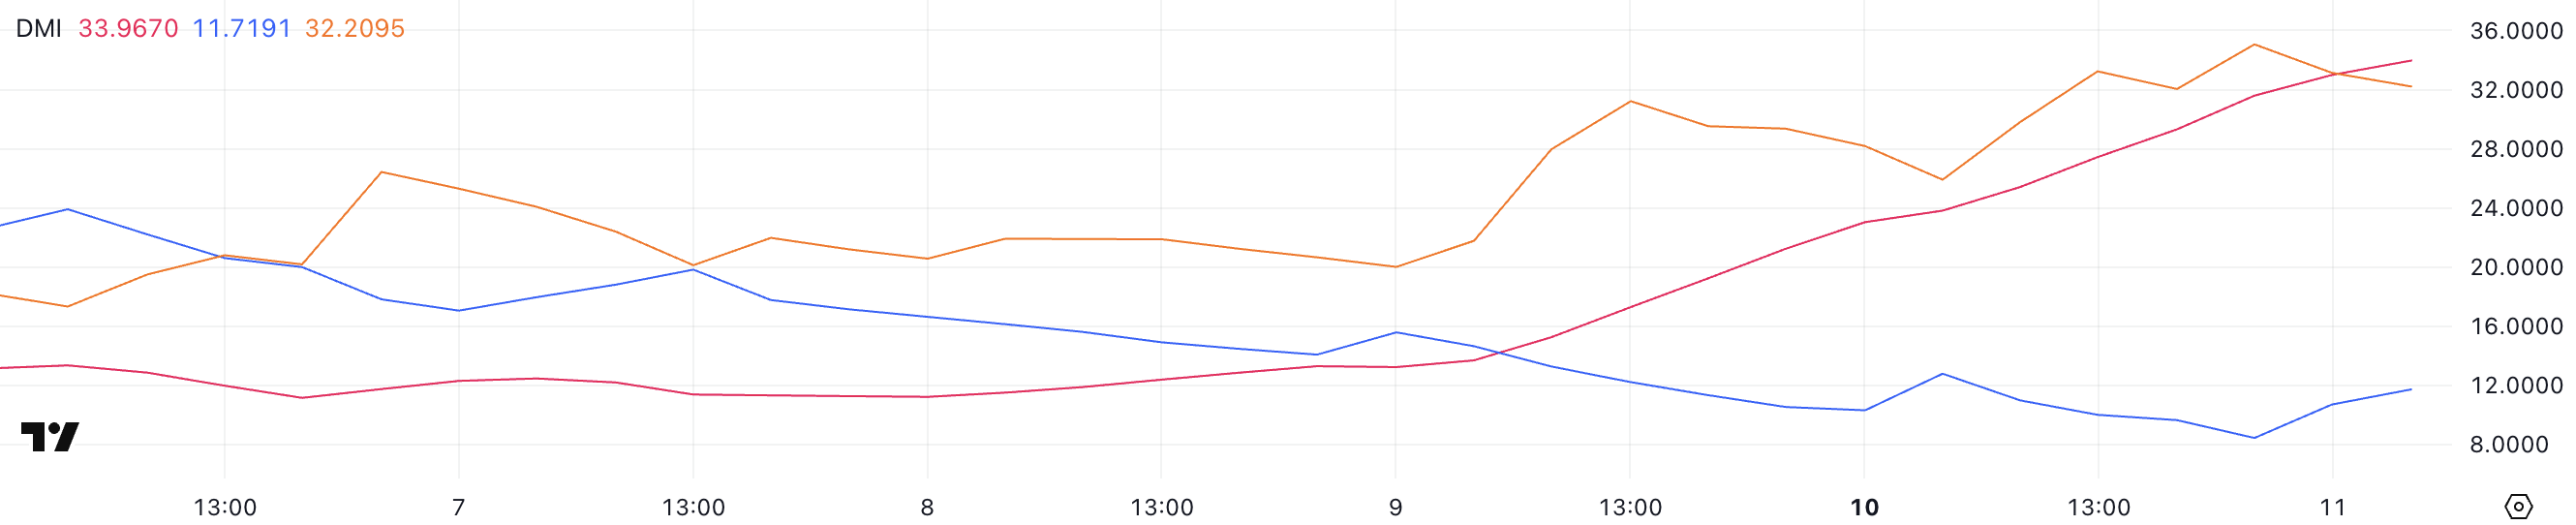
The relative positioning of the +DI and -DI lines suggests that sellers are still in control, as the -DI remains significantly higher than the +DI.
The recent dip in -DI from 35 to 32.2 could indicate some short-term relief, but with the ADX climbing quickly, it reinforces that the prevailing downtrend remains intact.
The slight bounce in +DI suggests minor buying pressure, but it’s not enough to shift momentum in favor of bulls. Until +DI rises above -DI or ADX starts declining, SOL’s bearish trend is likely to persist, with sellers dominating price action in the near term.
Will Solana Fall Below $110?
Solana Exponential Moving Average (EMA) lines continue to depict a bearish trend, with the short-term EMAs positioned below the long-term EMAs.
This alignment suggests that downward momentum remains dominant, even though the price is currently attempting a recovery. If this rebound gains strength, Solana’s price could face resistance at $130 and $135, key levels that must be cleared for any potential trend reversal.
A successful break above these resistances could push SOL toward $152.9, a significant level that, if breached with strong buying pressure, might pave the way for a rally toward $179.85 – the price level last seen on March 2, when SOL was added to the US crypto strategic reserve.
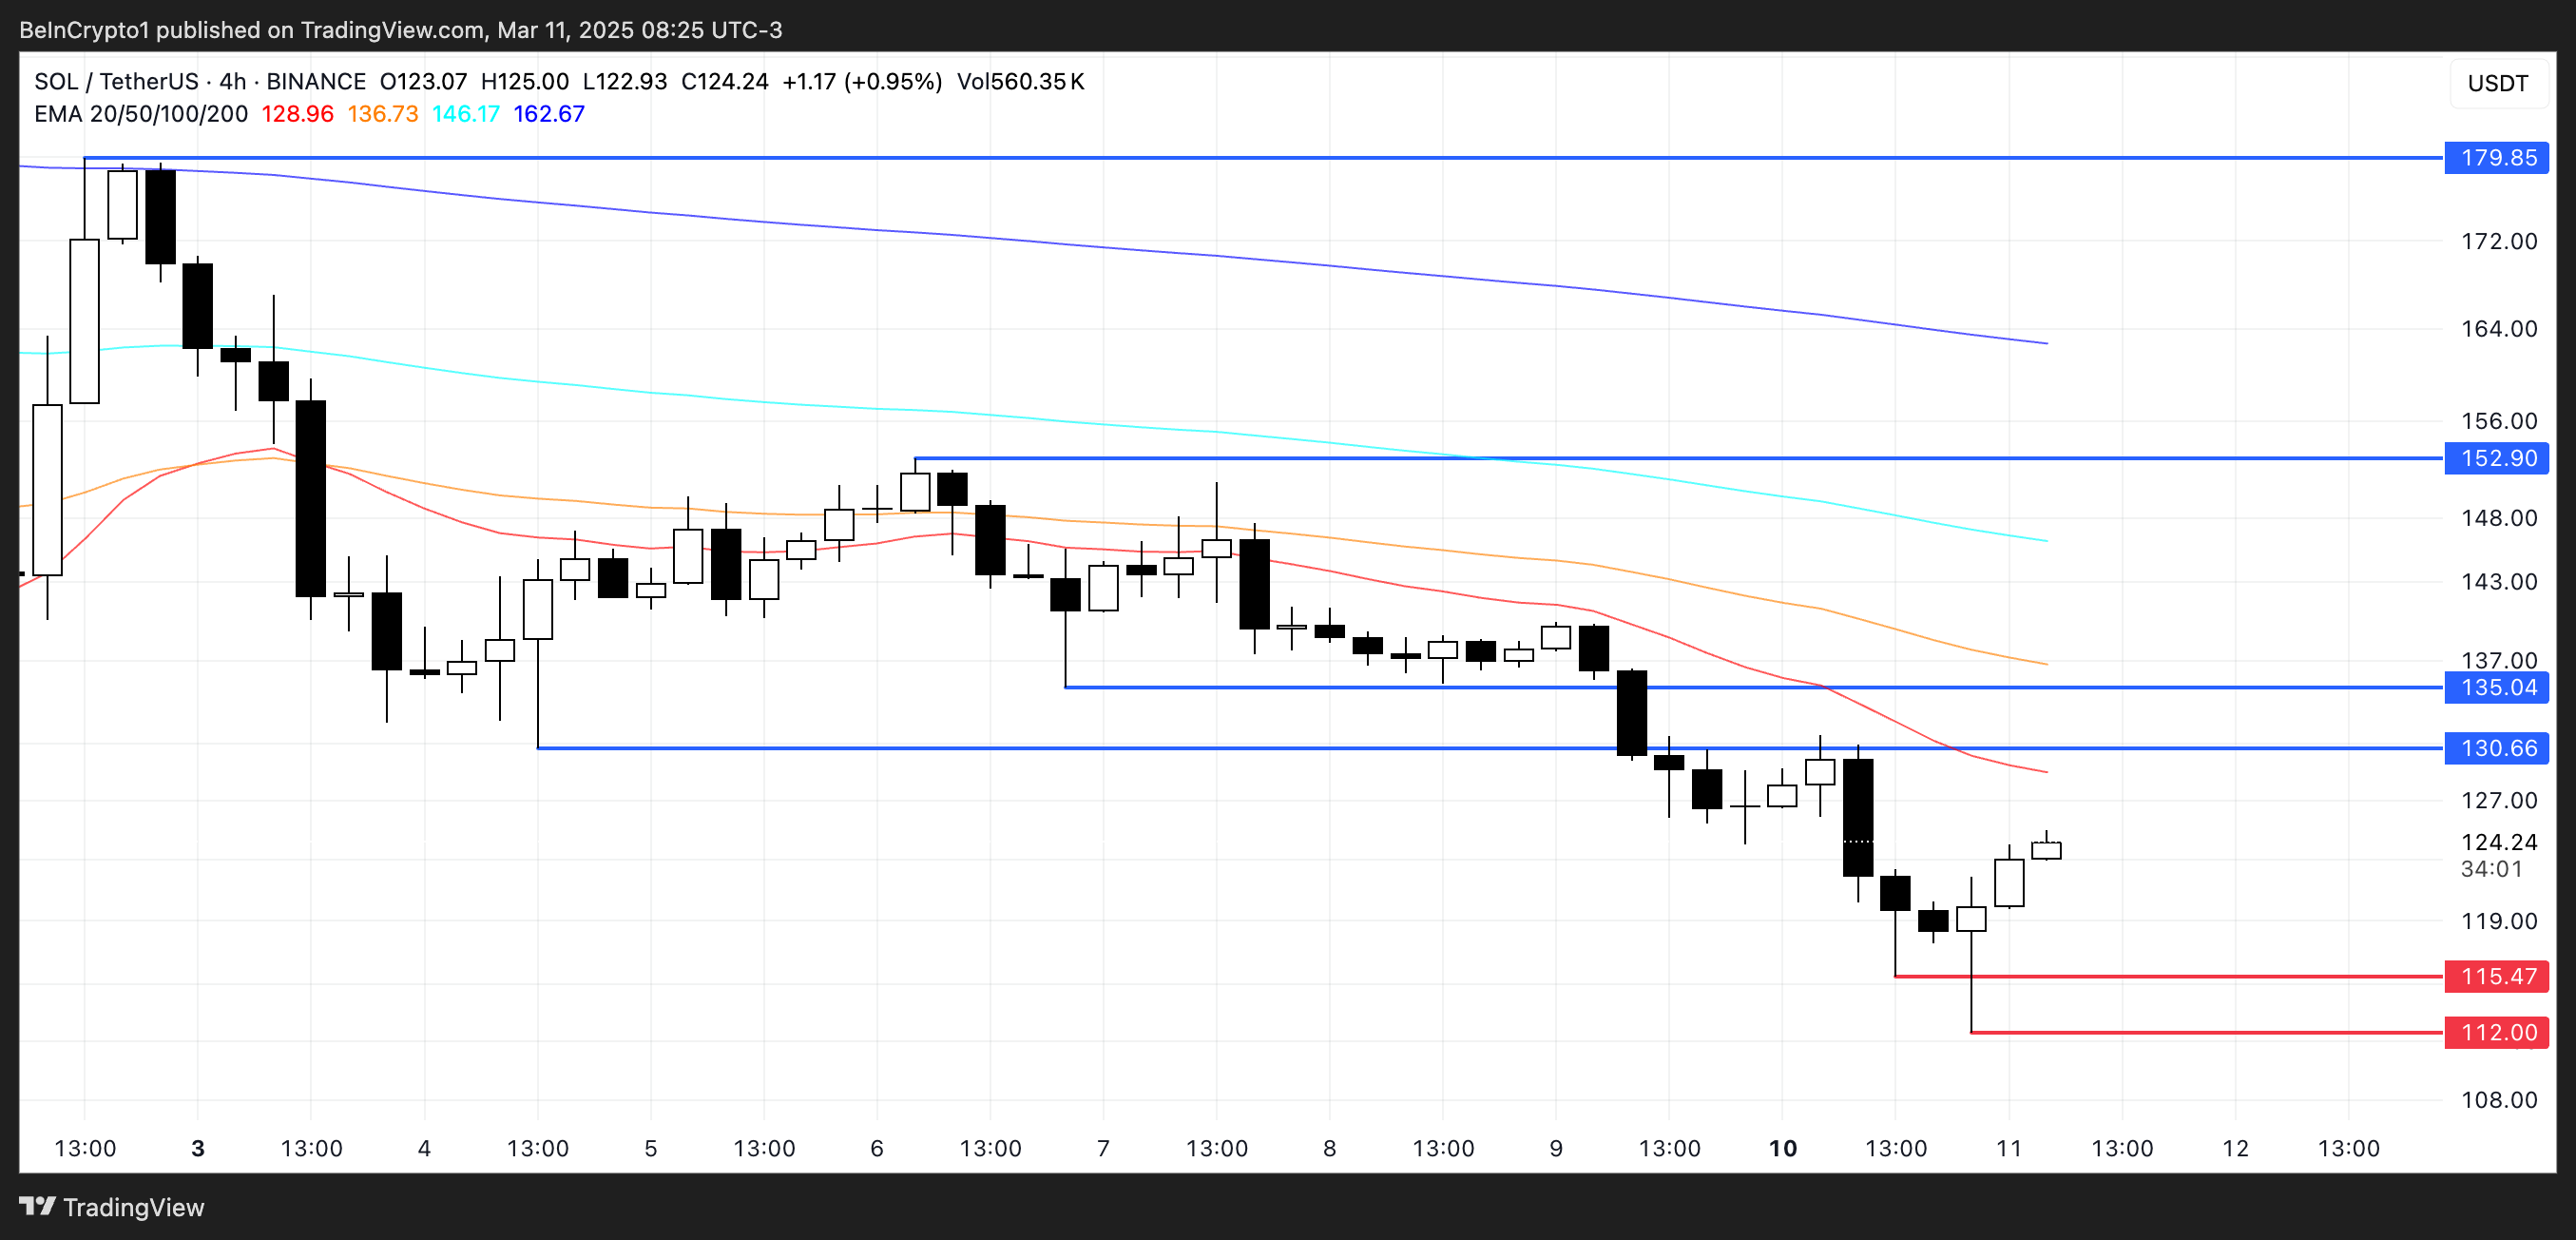
However, if the bearish structure remains intact and selling pressure resumes, Solana could retest the $115 and $112 support levels, both of which have previously acted as key price floors.
A failure to hold these supports could open the door for a deeper decline, possibly pushing SOL below $110 for the first time since February 2024.
Given the EMAs’ current positioning, the downtrend remains in control unless Solana reclaims key resistance levels and establishes a bullish crossover, signaling a shift in market sentiment.
Disclaimer
In line with the Trust Project guidelines, this price analysis article is for informational purposes only and should not be considered financial or investment advice. BeInCrypto is committed to accurate, unbiased reporting, but market conditions are subject to change without notice. Always conduct your own research and consult with a professional before making any financial decisions. Please note that our Terms and Conditions, Privacy Policy, and Disclaimers have been updated.