Bitcoin Breakdown Signals New Bear Market Lows To Come For Stocks (NASDAQ:QQQ)
Vertigo3d
As I detailed in my Seeking Alpha article “The Big Mistake Most Bitcoin Investors Make” in August 2021, contrary to the belief of many investors at that time, the prices of Bitcoin and stocks are typically positively correlated, while the prices of Bitcoin and gold are typically negatively correlated.
I also noted that “Bitcoin and stocks generally have the strongest bull and bear market moves when they are aligned together” and “Bitcoin price tops and bottoms often lead stocks” such as “the late 2017 Bitcoin top, the late 2018 Bitcoin bottom, the mid-2019 Bitcoin top and the March 2020 Bitcoin bottom”.
Based on this historical analysis, I provided the following thoughts for investing in Bitcoin, gold and stocks:
That means Bitcoin prices are driven by the same bullish and bearish investor psychology and economic trends as stocks are. Thus, instead of focusing on the fundamental factors investors believe drive gold prices (such as inflation and uncertainty), smart Bitcoin investors should focus on the economic and investor psychology trends that drive stocks. Similarly, smart stock investors should focus on Bitcoin trends and psychology.”
I concluded with the following:
What Now?
After falling over 50% from April to July this year, Bitcoin has recovered somewhat in recent weeks. But it still remains about 25% below its all-time high in April, despite significant Fed money creation and the highest inflation rates in years! Both Bitcoin and stock investors should tread cautiously going forward, since Bitcoin has rarely fallen that much without further downside in both Bitcoin and stocks.”
While Bitcoin and stocks rallied to new highs over the following few months, they both suffered significant bear market declines in 2022. Bitcoin fell nearly 80% and the NASDAQ 100 ETF QQQ fell nearly 40% from their late 2021 highs to their 2022 lows. After rallying strongly this year, Bitcoin is still down about 60% and QQQ is down about 8% from their highs.
Bitcoin Is Breaking Down Again
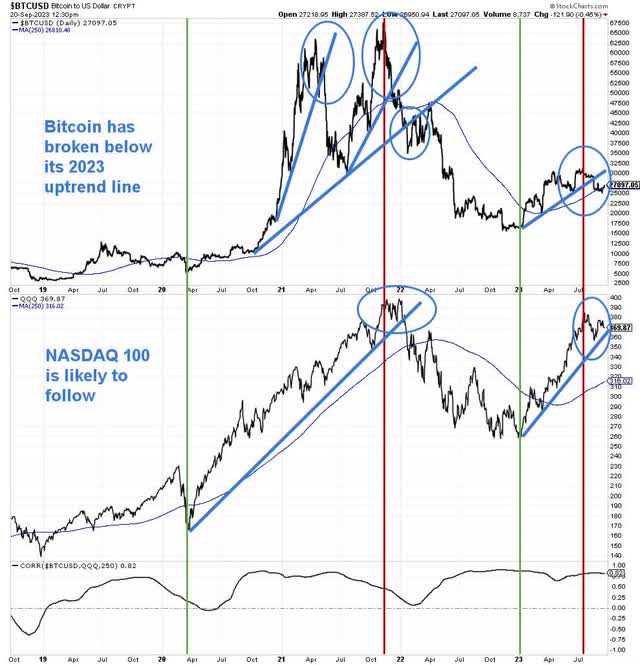
The chart below shows Bitcoin prices in the top clip and QQQ prices in the middle clip. The 250-day (one trading year) correlation is in the bottom clip. It shows the correlation between Bitcoin and QQQ over the past year has been very high at 0.82.
I have drawn blue trend lines for major rallies since 2020 and blue circles around periods when prices broke below those trend lines, signaling selloffs. As this chart shows, using trend lines has been very helpful in identifying the early stages of major weakness for both Bitcoin and QQQ.
I also placed green vertical lines on major bottoms for Bitcoin and QQQ in March 2020 and January 2023 and red vertical lines on major tops in November 2021 and (I believe) July 2023.
The latest blue circle for Bitcoin shows it has recently broken below the uptrend line that has been in place all year. But the blue circle for QQQ shows it has not broken below its 2023 uptrend line yet. We believe it will soon.
Bear Market Is Not Over
The strong rally in stocks this year has led many if not most investors to believe that the bear market ended in 2022 and a new bull market has begun. I disagree for a variety of technical and fundamental reasons.
One key technical reason is that the rally has largely been driven by a handful of mega-cap Tech stocks like NVIDIA, Apple, Microsoft, Google, etc. A typical sign of a healthy new bull market is the widespread participation of a majority of stocks in the rally, not just a small number of large-cap stocks.
But despite the big rally in stocks – and the QQQ, in particular – this year, the percentage of NASDAQ stocks that were trading above their key 200-day moving averages (“200-dma”) never rose above 55% this year. Currently, only 32% of NASDAQ stocks are trading above their 200-dma. That means more than two-thirds are in bearish downtrends.
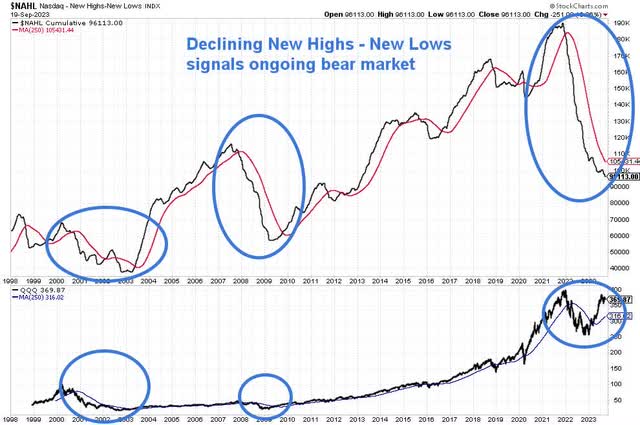
This next chart shows the cumulative number of New Highs less New Lows for the NASDAQ Index with its 250-dma (red line) in the top clip and QQQ in the bottom clip. This important measure of market breadth has continued to fall to new lows, despite the rally this year. As the chart shows, this metric turned up and rallied above its 250-dma at the beginning of the bull markets of 2003 and 2009. Since that has not happened yet, I believe this is a key signal that the bear market that began in 2022 is not over.
A Recession Is Coming
Stocks typically fall significantly during recessions. As I recently detailed in my Seeking Alpha article “4 Reasons A Long Recession Is Likely To Start Soon”, I think a recession is coming soon, if it isn’t already started.
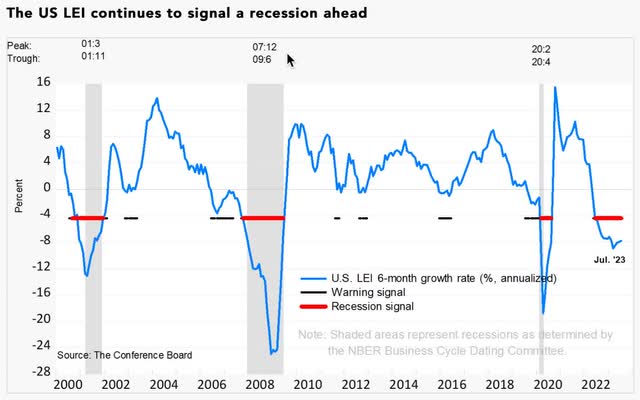
Among many other reasons I could cite is the chart below of The Conference Board’s Leading Economic Index, which has fallen to levels only seen during recessions (below red recession signal line).
According to Justyna Zabinska-La Monica, Senior Manager of Business Cycle Indicators at The Conference Board:
The US LEI-which tracks where the economy is heading-fell for the sixteenth consecutive month in July, signaling the outlook remains highly uncertain. On the other hand, the coincident index (CEI), which tracks where economic activity stands right now, has continued to grow slowly but inconsistently, with three of the past six months not changing and the rest increasing. As such, the CEI is signaling that we are currently still in a favorable growth environment. However, in July, weak new orders, high interest rates, a dip in consumer perceptions of the outlook for business conditions, and decreasing hours worked in manufacturing fueled the leading indicator’s 0.4 percent decline. The leading index continues to suggest that economic activity is likely to decelerate and descend into mild contraction in the months ahead. The Conference Board now forecasts a short and shallow recession in the Q4 2023 to Q1 2024 timespan.”
I disagree with The Conference Board’s expectations about the coming recession. While this index points to a recession, but it does not tell us anything about the length and severity of the recession. As I discussed in my August 2021 Seeking Alpha article “5 Reasons The Next Stock Bear Market And Recession Could Be The Worst Since The 1930s”, I think there are many reasons why the coming recession will likely be long and deep.
Investor Complacency Is Sky-High Despite Risks Being Sky-High
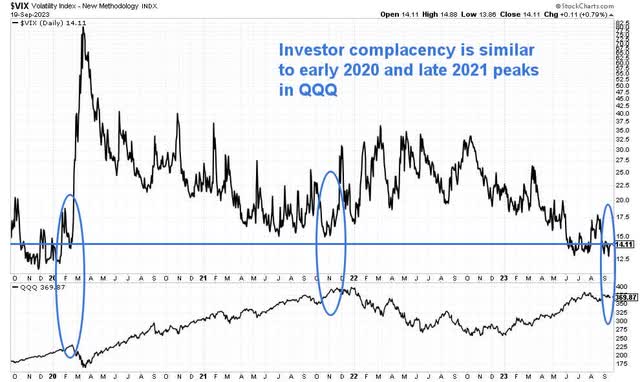
Despite the current weakness of Bitcoin and most stocks, as well as proven leading economic indicators pointing to a recession, investor complacency is sky-high. The chart below shows the CBOE Volatility Index (“VIX”) in the top clip, which is a useful measure of investor complacency and fear, along with QQQ in the bottom clip.
Typically, when the VIX is low, it signals investors are very complacent about risks, which typically occurs near stock market tops. Conversely, when the VIX is high, it signals investors are very fearful, which typically occurs near stock market bottoms.
The VIX is currently at a very low level of 14, which is near the lows it was at near the market peaks in early 2020 and late 2021, as the blue circles show. The VIX shows that investors are very complacent, despite the significant risks I have presented in this and other articles.
What Now?
Since prices of financial assets like Bitcoin and stocks are ultimately driven by investor psychology of fear and greed, they can do anything they want, particularly in the short term. But with Bitcoin having broken below its 2023 trend line, market breadth remaining very bearish, leading economic indicators flashing red and investor complacency sky-high, I believe the odds are that Bitcoin and stocks, including QQQ, will fall to new bear market lows. Wise investors should plan accordingly.
